TradingView Ticker Tape

Monday, 6 November 2023

Forex Breakout Strategy: A Guide for Profitable Trading

If you’re a forex trader looking for a profitable trading strategy, you’re in the right place. The forex market is known for its volatility and fast-paced nature, making it an ideal environment for breakout and trading strategies. In this article, we will explore the Forex Breakout Strategy and provide you with a comprehensive guide to help you trade breakouts successfully in forex markets.


In this discussion:

  • We will explain what a breakout is in the forex market and why it is a significant trading opportunity. We’ll discuss key concepts such as support and resistance levels, trend lines, and consolidation patterns.

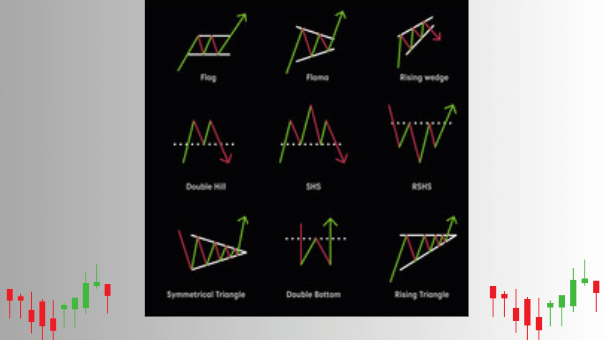
  • You will learn how to identify potential breakout setups using various technical analysis tools. We’ll explore breakout patterns like triangles, rectangles, and head and shoulders formations, and teach you how to spot them on price charts.

  • Once you’ve identified a breakout setup, knowing when to enter and exit a trade is crucial. We’ll discuss different entry strategies such as buying on a breakout above resistance or selling on a breakout below support. Additionally, we’ll cover stop-loss placement and take-profit targets to help you manage your trades effectively.

  • Successful trading requires proper risk management. We’ll emphasize the importance of setting appropriate position sizes, using stop-loss orders, and managing your overall risk-to-reward ratio to protect your capital and maximize profits.

  • For more experienced traders, we’ll dive into advanced breakout techniques such as fakeouts and pullback breakouts. These strategies can help you capitalize on market reversals and optimize your trading edge.

  • Lastly, we’ll address the psychological aspect of breakout trading. We’ll discuss the importance of discipline, patience, and controlling emotions while executing your breakout strategy. Understanding and managing your mindset is essential for long-term success.

By the end of this discussion, you’ll have a clear understanding of the Forex Breakout Strategy and how to implement it effectively in your trading. Whether you’re a beginner or an experienced trader, this guide will equip you with the knowledge and tools necessary to identify breakout opportunities, manage your risk, and ultimately increase your profitability in the forex market.

Get ready to take your forex trading move to the next level with the power of breakouts.

Forex Breakout Strategy: A Guide for Profitable Trading

Forex Breakout Strategy: A Guide for Profitable Trading

How to Identify Breakout in the Forex Market

To effectively identify breakouts in the forex market, you most traders can follow these key strategies:

Look for key levels of support and resistance on a forex chart

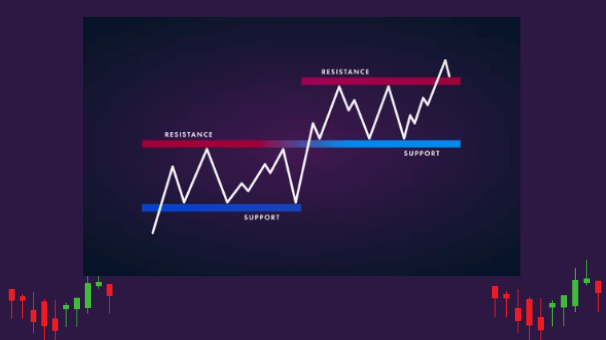
Support and resistance levels are areas where price has historically reversed or stalled. When price breaks above a resistance level or below a support level, it could indicate a potential breakout. These levels can be identified using technical analysis tools such as trend lines, horizontal lines, or moving averages.

Use technical indicators to confirm a potential breakout

Technical indicators can provide additional confirmation of a breakout. For example, the Relative Strength Index (RSI) and Moving Average Convergence Divergence (MACD) are commonly used momentum indicators. An increase in the RSI value or a bullish crossover on the MACD histogram could signal a strengthening breakout.

Watch for a sharp increase in trading volume

Breakouts are often accompanied by a surge in trading volume. High volume indicates increased market participation and conviction, validating the breakout. Monitoring volume patterns can help confirm the strength of a breakout and differentiate it from false breakouts with low volume.

Monitor news events that could impact the currency pair you are trading

Economic announcements, geopolitical events, and central bank decisions can significantly move stock indices and impact currency pairs. News releases can act as catalysts for breakouts by creating volatility and shifting market sentiment. Stay updated on relevant news events to identify potential breakout opportunities.

Use price action analysis to confirm a breakout

Price action analysis involves observing and interpreting the movement of price action signals on the chart. Look for strong bullish or bearish candlestick patterns that confirm the breakout. For example, a bullish breakout may be confirmed by a strong bullish candlestick closing above the resistance level.

By using forex trades and combining these trading strategies together, you can increase your ability to identify and confirm breakouts in the forex market. Remember to practice proper risk management in forex markets and always use stop-loss orders to protect your forex trades.

Types of Breakout Strategies

When it comes to forex and trading strategies, breakout strategies are widely used by traders to identify potential profit opportunities in financial markets. In this article, we will explore different types of breakout trading strategies, that can be employed to enhance your forex trading success.

Momentum Breakout

Momentum breakout strategy focuses the bullish traders on identifying strong and sustained price movements. Traders look for instances where the price breaks through a key level of either resistance level or support with a surge in trading volume. This indicates a significant shift in market sentiment, potentially leading to a profitable trade.

Reversal Breakout

Reversal breakout strategy aims to identify potential trend reversals in the market. Traders closely see price movement in the futures markets and monitor price patterns and technical indicators to spot situations in futures markets where the price breaks through a support or resistance level, indicating a reversal of the prevailing trend. By entering trades at the early stages of a major trend reversal in futures contracts, traders can potentially capitalize on the change in market direction.

Trendline Breakout

Trendline breakout strategy involves the use of trendlines, which connect a series of higher lows or lower highs on a price chart. When the price breaks through a strong trend-line, it signifies a potential shift in market dynamics. Traders use this breakout of strong a trend line, as a signal to enter trades in the direction of the breakout, aiming to ride the new trend line up for maximum profit.

News Event Breakout

News event breakout is trading strategy that capitalizes on the impact of significant news releases on the forex market. Traders pay close attention to economic indicators, central bank announcements, geopolitical events, and other market-moving news. When a news event causes a breakout, traders attempt to enter trades in the direction dictated by the news, taking advantage of the resulting market volatility.

Volatility Breakout

Volatility breakout strategy focuses on identifying periods of high market volatility. Traders look for situations where the price breaks through a range or consolidates pattern, indicating an increase in volatility. By entering trades during volatile periods, traders can potentially profit from significant price movements.

By understanding and utilizing these different types of breakout strategies, forex traders can enhance their ability to identify profitable trading opportunities. However, it is crucial to remember that no strategy guarantees success, and risk management should always be a priority in trading endeavors.

Best Indicators to Use for Forex Breakout Trading

When it comes to breakout trading in the forex market, using the right indicators can help you identify potential breakouts and confirm their strength. Here are some of the best indicators to consider:

Bollinger Bands

Bollinger Bands are a popular volatility indicator that consist of three lines plotted on the price chart. The middle band is a simple moving average (typically 20 periods), while the upper and lower bands represent the standard deviations from the moving average. Breakouts often occur when the price breaks above or below the outer bands, indicating increased volatility and potential trend continuation.

Moving Average

Moving averages are widely used indicators that help identify trend direction and potential breakout points. Traders often use the crossover of two moving averages or the price crossing above or below a moving average as a sign of a breakout. For example, when a shorter-term moving average crosses above a longer-term moving average, it could indicate an upward breakout signal.

Relative Strength Index (RSI)

The RSI is a momentum oscillator that measures the speed and change of price movements. It ranges from 0 to 100 and is typically used to identify overbought and oversold conditions. In breakout trading, traders look for the RSI to move above 70 for a bullish breakout or below 30 for a bearish breakout. This can help confirm the strength of the breakout and potential trend continuation.

Ichimoku Cloud

The Ichimoku Cloud is a comprehensive indicator that provides multiple pieces of information in one visual display. It consists of several lines and a shaded area called the cloud. When the price breaks above or below the cloud, it can signal a potential breakout. Additionally, the Tenkan-sen (conversion line) crossing above the Kijun-sen (base line) can provide a bullish breakout signal, while the opposite can indicate a bearish breakout.

Average True Range (ATR)

The ATR is a volatility indicator that measures the average range between high and low prices over a specific period. Traders can use the ATR to determine the potential price range and volatility levels. A breakout that is accompanied by a significant increase in ATR suggests a potentially strong breakout with higher volatility.

Remember that indicators should not be used in isolation, but in conjunction with other analysis techniques to increase the likelihood of successful breakout trades. Additionally, it’s important to test and adapt your indicator settings and strategies based on the specific currency pairs and timeframes you trade.

Risk Management Strategies for Breakout Trading

When trading breakouts in the forex market, implementing effective risk management strategies is crucial to protect your capital and maximize your profits. Here are some key strategies to consider:

Use a stop-loss order

Placing a stop-loss order is an essential risk management tool for breakout traders. A stop-loss order instructs your broker to automatically close your position if the price moves against you beyond a certain, price level. By setting a stop-loss order, you limit your potential losses and protect your trading account from significant drawdowns.

Set a profit target

In addition to setting a stop-loss order, it’s important to have a predefined profit target for your breakout trades. A profit target determines your entry point and exit point, and when you will exit the trade and lock in your gains. It helps you maintain discipline and avoid holding onto a winning trade for too long, which can result in giving back profits if the market reverses.

Use proper position sizing

Proper position sizing is vital for managing risk in breakout trading. Determine the appropriate position size based on your account size and risk tolerance. Many traders recommend risking only a small percentage of your trading capital (e.g., 1-2%) on each trade. This way, even if multiple trades result in losses, you can withstand the drawdown and continue trading.

Consider the market conditions

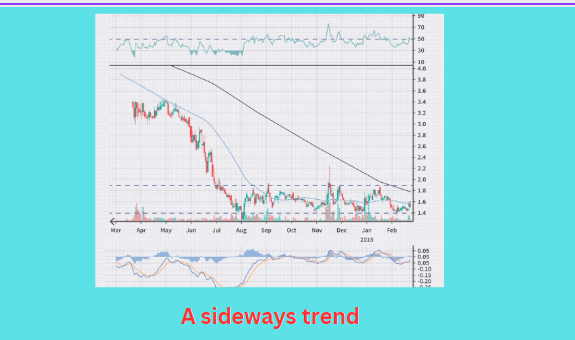
Market conditions can greatly impact the success of breakout trades. When assessing market conditions, consider factors such as volatility, liquidity, and overall trend. Breakouts tend to work best in trending markets with higher volatility and sufficient trading volume. Avoid trading breakouts in sideways or range-bound markets where false breakouts are more common.

Avoid overtrading

Overtrading is a common mistake that can lead to increased risk and poor decision-making. Stick to your trading plan and avoid the temptation to enter trades that do not meet your breakout criteria. Wait for high-quality setups with clear breakout signals and favorable risk-to-reward ratios. By being selective and disciplined, you can avoid unnecessary losses and focus on the most promising breakout opportunities.

Implementing these risk management strategies can help you protect your trading capital, minimize losses, and increase your overall profitability in breakout trading. Remember to regularly review and adjust your risk management approach as market conditions change.

Common Mistakes to Avoid When Trading Breakouts

When trading breakouts in the forex market, it’s crucial to be aware of common pitfalls that can hinder your success. By avoiding these mistakes, you can improve your forex trading strategy and increase your profitability. Here are some common mistakes to be mindful of:

Common Mistakes to Avoid When Trading Breakouts

Chasing the breakout

One common mistake is entering a trade too late, after the breakout has already occurred and the price has moved down the trend line even more significantly. This can result in entering at unfavorable prices and missing out on potential profits. It’s important to wait for a proper setup and confirmation down trend, before entering a trade.

Failing to use stop-loss orders

A stop-loss order is an essential risk management tool that helps limit potential losses. Failing to set and adhere to stop-loss orders can expose you to significant risks. By setting a stop-loss order at a reasonable price level, you can protect yourself from large losses if the breakout fails or reverses.

Overtrading

Overtrading is a common mistake made by traders who try to capture every breakout opportunity. It’s important to remember that not all breakouts are successful, and trading too frequently can lead to unnecessary losses. Be selective and focus on high-quality setups rather than trading impulsively.

Not considering market conditions

Market conditions can greatly influence the success of breakout trades. Failing to consider factors such as volatility, liquidity, and overall market sentiment can result in trading breakouts in unfavorable conditions. Take into account the broader market context and adjust your trading strategy accordingly.

Ignoring risk management

Proper risk management is crucial in trading breakouts. Failing to assess and manage risk appropriately can lead to significant losses. Determine your risk tolerance, set realistic profit targets, and ensure your risk-to-reward ratio is favorable before entering a trade.

Holding onto losing trades

Holding onto losing trades in the hope that they will eventually turn profitable is a common mistake made by traders worldwide. Breakout trades can sometimes fail, and it’s important to cut your losses and move on. Accepting small losses day trading, is part of the trading process and helps preserve your capital for future opportunities.

By being aware of these common mistakes many traders make and actively avoiding them even a novice of, you can enhance your breakout trading strategy. Remember to approach breakout trading strategy with discipline, patience, and a focus on risk management to increase your chances of success.

Frequently asked questions about the Forex breakout strategy

Different types of forex break strategies

What is a Forex breakout trading strategy?

A Forex breakout strategy is a trading technique that involves identifying key levels of support and resistance and placing trades when the price breaks out of these levels with strong momentum. Traders aim to take advantage of significant price movements that occur after a breakout.

How does the Forex breakout strategy work in financial markets

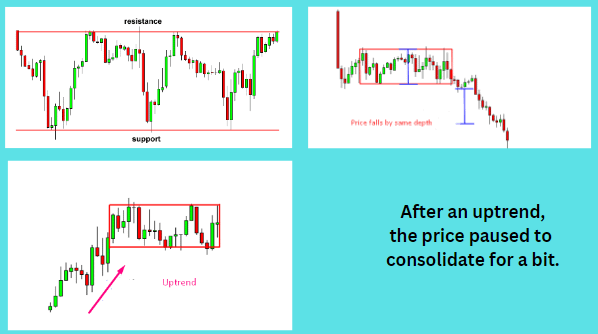
The Forex breakout strategy works by identifying consolidation periods in the market where the price is range-bound between support and resistance levels. Traders wait for the price to break above or below these levels, indicating a potential trend reversal or continuation, and enter trades accordingly.

What are the benefits of using Forex breakout trading strategies?

Using a Forex breakout strategy can provide several benefits many traders, including the ability to catch large price movements, increased trading opportunities, clear enough entry points and exit signals, and the potential for high-profit trades.

What indicators can be used to identify breakouts?

Traders often use indicators such as moving averages, Bollinger Bands, and the Average True Range (ATR) to identify potential breakouts. These indicators help to confirm the strength and validity of a breakout.

How do I determine the best time frame for breakout trading?

The choice of time frame to trade on depends on your trading style and preferences. Shorter time frames like 5-minute or 15-minute charts can provide more frequent trading opportunities, while longer time frames like daily or weekly charts offer more reliable and significant breakouts.

How do I manage risk when trading breakouts?

Risk management is crucial when planning your breakout trading strategies. Traders often use stop-loss orders to limit potential losses if the breakout fails. Additionally, they may employ proper position sizing techniques and consider implementing trailing stops to protect profits.

Are there any drawbacks to breakout trading strategy?

One drawback of breakout trading is the possibility of false breakouts, where the price briefly breaks out of a level but quickly reverses. This can result in losses if traders enter trades based on these false breakout signals. It is essential to use confirmatory indicators and analyze the market context before entering trades on trade breakouts.

Are there any strategies to filter out false breakouts?

Yes, traders can use additional filters to reduce the likelihood of trading false breakouts. These may include analyzing the volume during the breakout, looking for multiple time frame confirmations, or waiting for a pullback and retest of the breakout level before entering a trade.

What are Price Patterns

Price patterns are a popular tool used by traders to analyze and predict market movements based on the price movements alone, without relying on indicators or other technical tools. These patterns can provide valuable insights into market trends, reversals, and continuations. Here are some commonly used, price action trading patterns:

  1. Reversal Bar: This pattern occurs when the price forms a bar that indicates a potential reversal in the current trend. It often has a long wick or tail, signaling a rejection of previous price levels.

  2. Key Reversal Bar: Similar to the reversal bar, the key reversal bar signifies a potential trend reversal. It typically has a wide range and engulfs the preceding bars.

  3. Pinocchio Bar: Also known as a pin bar, this pattern has a long tail or wick, indicating a rejection of a certain price level. It can be a bullish or bearish signal, depending on its location within the trend.

  4. Exhaustion Bar: The exhaustion bar suggests a weakening of the prevailing trend. It often has a high volume and a wide range, indicating that the buyers or sellers are losing momentum.

  5. Three-Bar Pullback: This pattern occurs when the price temporarily retraces against the prevailing trend for three consecutive bars. It is often followed by a continuation of the original trend.

  6. False Break: A false break happens when the price briefly breaks a significant support or resistance level but quickly reverses and moves back in the opposite direction. It can trap traders who enter trades based on the breakout.

These price action patterns are just a few examples of the many price movement patterns that traders use to make trading decisions. It’s important to understand that price action patterns should be used in conjunction with other technical analysis tools and should be validated by market context and other indicators.

Points To Keep In Mind About Breakout Trading Strategy

The Forex Breakout Strategy is a powerful tool that can help traders capitalize on the volatility and momentum in the forex market. By understanding the concepts of support and then resistance price levels, identifying breakout setups and price move, using chart patterns and using technical indicators, traders can increase their chances of profitable trading.

The ability to identify key levels of support and resistance on a forex chart is essential for successful breakout trading. These levels serve as potential entry and exit points, giving traders a clear framework for executing forex trades on. Additionally, using technical indicators such as the RSI and MACD can provide confirmation of a potential breakout, increasing the reliability of forex trade signals.

Volume, technical analysis, and monitoring news events are crucial components of breakout trading. High trading volume during a breakout suggests strong market participation, while keeping an eye on news events helps traders anticipate potential trends and catalysts for breakouts. By combining these factors, traders can make more informed trading decisions, and improve their trading outcomes.

Price action analysis further solidifies the validity of breakouts by observing chart pattern on the candlestick charts and the movement of price action traders on the chart. Strong enough price action trading on candlestick charts and patterns can confirm the breakout and provide additional conviction for traders to enter or exit positions.

However, it’s important to remember that risk management is a simple strategy and paramount in breakout trading. Setting appropriate position sizes, using stop-loss orders, and maintaining a favorable risk-to-reward ratio are essential to protect capital and preserve long-term profitability in short trades.

Conclusion

By following the strategies outlined in this guide and mastering the art of breakout trading in forex markets, traders can potentially unlock new opportunities for profit in the forex market. Remember, practice, discipline, and continuous learning are key to become a successful breakout trader in forex markets.

Read these next;

Forex Consolidation Breakout Strategies for Traders

Managing Risks in Forex Trading Without Brokers

Understanding Forex Market Imbalance and How to Use It


Disclaimer:

All information has been prepared by TraderFactor or partners. The information does not contain a record of TraderFactor or partner’s prices or an offer of or solicitation for a transaction in any financial instrument. No representation or warranty is given as to the accuracy or completeness of this information. Any material provided does not have regard to the specific investment objective and financial situation of any person who may read it. Past performance is not a reliable indicator of future performance. 

FOLLOW US

Author

  • Zahari Rangelov

    Zahari Rangelov is an experienced professional Forex trader and trading mentor with knowledge in technical and fundamental analysis, medium-term trading strategies, risk management and diversification. He has been involved in the foreign exchange markets since 2005, when he opened his first live account in 2007. Currently, Zahari is the Head of Sales & Business Development at TraderFactor's London branch. He provides lectures during webinars and seminars for traders on topics such as; Psychology of market participants’ moods, Investments & speculation with different financial instruments and Automated Expert Advisors & signal providers. Zahari’s success lies in his application of research-backed techniques and practices that have helped him become a successful forex trader, a mentor to many traders, and a respected authority figure within the trading community.

Thursday, 2 November 2023

Forex Consolidation Breakout Strategies for Traders

If you’re a trader looking to maximize your profits while minimizing risks, one way to achieve this is through consolidations or breakouts in the forex market. Consolidation Breakout Strategies are widely used by Forex traders as they can provide beneficial entries and exits into deals with lower losses than normal trades.


Here, we’ll explore what consolidation breakout strategies are and how they can be applied effectively for traders looking to benefit from price movements within these markets. With careful application of consolidated trading ranges, a trader has greater control over their risk exposure when investing in Forex markets.

Overview: Forex Consolidation Breakout Strategies for Traders

When it comes to Forex consolidation breakout strategies, there are various approaches that traders can employ. Here are some key points to focus on:

Understanding Breakouts

A breakout occurs when the price of a currency pair surpasses a certain level of support or resistance, indicating a potential shift in market sentiment and the start of a new trend.

Identifying Consolidation Patterns

Traders should learn to recognize different types of consolidation patterns, such as sideways ranges, triangles, rectangles, pennants, wedges, and diamonds. Each pattern has its own characteristics and may provide different trading opportunities.

Entry and Exit Strategies

Traders need to develop effective entry and exit strategies for breakout trades. This includes setting appropriate stop-loss and take-profit levels, as well as determining the optimal time to enter a trade based on the breakout confirmation.

Risk Management

It’s essential to manage risk properly when trading consolidation breakouts. Traders should calculate their position size based on their risk tolerance and set strict risk-reward ratios to ensure that potential profits outweigh potential losses.

Confirmation Techniques

Traders often use technical analysis tools to confirm breakout signals. These may include indicators like moving averages, trendlines, and chart patterns. By combining these tools with consolidation breakout strategies, traders can increase the probability of successful trades.

Common questions that traders may have about consolidation breakout strategies include:

  • How do you identify valid breakout signals?

  • Which currency pairs are best suited for breakout strategies?

  • What time frames are most effective for trading consolidations?

  • How do you handle false breakouts?

  • Are there any specific indicators or tools that can help in identifying consolidations and breakouts?

By exploring these topics and providing insights into the different types of consolidations and breakout strategies, traders can enhance their understanding and make informed trading decisions.

Different Types of Consolidations

Sideways Consolidations

A example of a sideways trend in forex consolidation

Sideways consolidations refer to a specific pattern of price movement in the financial markets. It is characterized by a period of consolidation or indecision, where the price fluctuates within a limited range. During sideways consolidations, neither the buyers nor the sellers are in control, resulting in a horizontal trend.

This type of consolidation often occurs after an uptrend or downtrend and serves as a pause or a moment of indecision before the price continues its previous trend or reverses into a new trend. The prices tend to move within a narrow range, with support and resistance levels defining the boundaries of the consolidation.

Traders and investors closely monitor sideways consolidations as they may offer trading opportunities once the price breaks out of the consolidation range. Breakouts from sideways consolidations can indicate a potential shift in market sentiment and the start of a new trend.

It’s important to note that sideways consolidations can occur in various financial markets, including stocks, forex, commodities, and cryptocurrencies. Traders use technical analysis tools, such as support and resistance levels, chart patterns, and indicators, to identify and trade sideways consolidations effectively.

By understanding sideways consolidations and recognizing their characteristics, traders can potentially capitalize on the subsequent breakout moves or adjust their trading strategies accordingly to navigate this period of price consolidation.

Triangle Consolidations

Triangle consolidation pattern

Triangle consolidations are chart patterns in technical analysis that form a triangle-like shape and indicate a pause or consolidation in the prevailing trend. They are continuation patterns that can lead to a resumption of the previous trend.

There are different types of triangle consolidations, including symmetrical triangles and asymmetrical triangle patterns. Symmetrical triangle patterns exhibit low volatility and indicate a period of consolidation, while asymmetrical triangles suggest a potential breakout or reversal.

Traders often use triangle consolidations as a basis for trading strategies. The breakout from a triangle consolidation pattern can be a signal for entering trades in the direction of the breakout.

It’s important to note that triangle patterns can be found in various financial markets, such as trading stocks, commodities, and forex. Traders analyze these patterns using technical analysis tools and concepts like support zone and resistance zone, trend lines, and price breakouts.

Rectangle Consolidations

Rectangle Consolidation Pattern

Rectangle consolidation, also known as a trading range or a sideways channel, is a price pattern that occurs when the price of an asset moves within a relatively narrow range between parallel horizontal support and resistance levels. It is characterized by a series of highs and lows that create a rectangular shape on the price chart.

During a rectangle consolidation, the market is in a state of balance, with neither buyers nor sellers dominating the price action. This period of consolidation often occurs after a significant price move and serves as a pause or accumulation phase before the next major trend.

Traders and investors closely monitor rectangle consolidations as they can provide valuable insights into potential future price movements. Breakouts from the upper( larger positions) or lower boundary of the rectangle can signal the start of a new trend, providing trading opportunities for market participants.

When trading a rectangle pattern, a trader typically wait for a breakout above the resistance level or below the support level. The breakout direction may indicate the subsequent trend, and traders can enter positions accordingly.

It’s important to note that rectangle consolidations can be found in various financial markets, including stocks, commodities, forex, and cryptocurrencies. Traders use technical analysis tools, such as trend lines, support and resistance levels, and volume indicators, to identify and validate the rectangle consolidation pattern.

Pennant Consolidations

pennant consolidation showing consolidation boundaries

In forex trading, a pennant consolidation is a continuation pattern that occurs after a strong price movement or trend. It is named after its resemblance to a pennant flag, with a triangular shape formed by converging trend lines.

A pennant consolidation typically consists of two trend lines: an upper trend line, drawn along the highs of the price action, and a lower trend line, drawn along the lows. These trend lines converge towards each other, creating a narrowing pattern.

The pennant consolidation pattern represents a temporary pause in the price action, where buyers and sellers take a break before the next move. It signifies a period of indecision in the market, with decreasing volatility and decreasing trading volume.

Traders closely monitor pennant consolidations as they can provide valuable signals for potential future price movements. Breakouts from the pennant formation can indicate the resumption of the previous trend, providing traders with opportunities to enter trades in the direction of the breakout.

When trading a pennant consolidation, traders often wait for a breakout above the upper trend line for a bullish signal or a breakout below the lower trend line for a bearish signal. They may place stop-loss orders just outside the pennant formation to manage risk.

Keep in mind that pennant consolidations are best used in conjunction with other technical analysis tools and indicators to confirm trade signals when analyzing forex or stock. Additionally, traders should consider fundamental factors and news events that may impact the forex market.

Wedge Consolidation

wedge consolidation example


Wedge consolidation is a common chart pattern in forex trading. It is formed when the price of a currency pair moves within converging trendlines, creating a narrowing wedge shape. This pattern indicates a period of consolidation in the market, where buyers and sellers are in a state of equilibrium.

During wedge consolidation periods, the price typically oscillates between the upper and lower trendlines. Traders often look for a breakout from this pattern to signal a potential direction of the next major price movement.

A bullish breakout occurs when the price breaks above the upper trendline of the wedge, indicating a potential upward trend. Conversely, a bearish breakout happens when the price breaks below the lower trendline, suggesting a potential downward trend.

Traders can use various technical indicators and tools to confirm the validity of a wedge consolidation pattern and time their trades accordingly. It is important to consider other factors such as volume, support and resistance levels, and market conditions before making trading decisions based on this pattern.

Remember to conduct thorough analysis and consider risk management strategies before entering any trades. Forex trading involves risks, and it is essential to have a solid understanding of the market and proper risk management techniques.

Diamond consolidation

Diamond consolidation showing traders position and price bars

A diamond consolidation pattern, also known as a diamond bottom, is a bullish pattern that typically occurs after a downtrend in forex trading. It is characterized by a significant downward price move followed by a consolidation phase that forms swing points in the shape of a diamond.

The appearance of a diamond bottom pattern can resemble an inverted head and shoulders pattern, where the price forms higher lows and lower highs within the diamond shape. This pattern suggests a potential reversal of the previous downtrend and a bullish market sentiment.

Traders often look for confirmation signals such as a breakout above the upper trendline of the diamond pattern to enter long positions. The target for this pattern is usually projected by measuring the height of the diamond and adding it to the breakout point.

It is important to note that technical analysis patterns like the diamond consolidation should be used in conjunction with other technical indicators and analysis methods to make informed trading decisions.

Causes of Forex Consolidation

Economic News

Economic indicators and news releases such as GDP growth, employment data, inflation rates, and trade balances can have a significant impact on forex markets. Positive or negative economic news can lead to consolidation as traders wait for more clarity and identify consolidation before making new trading decisions.

Central Bank Decisions

The monetary policy decisions taken by central banks, including interest rate changes, quantitative easing programs, and policy statements, can influence forex markets. When central banks signal a more cautious or uncertain approach to their monetary policy, it can lead to a consolidation phase in the forex market.

Political Events

Political instability, geopolitical tensions, elections, and policy changes can all affect forex markets. Uncertainty surrounding political events can cause traders to adopt a wait-and-see approach, leading to consolidation in the forex market.

Market Sentiments

Sentiment and investor psychology play a crucial role in forex markets. During periods of uncertainty or risk aversion, traders may refrain from taking large positions, resulting in a periods consolidations phase.

Technical Factors

Technical analysis, including support and resistance levels, chart patterns, and trend indicators, can also contribute to forex consolidation. When a currency pair reaches a key technical level or enters a sideways trading range, it can lead to consolidation as traders wait for a breakout or breakdown.

It’s important to note that these factors are not exhaustive, and forex consolidation can be influenced by a combination of various factors. Additionally, market conditions and individual currency pairs can also impact the extent and duration of tight consolidation.

Breakout Strategies

Momentum Breakout

This strategy involves taking trades when there is a strong momentum move in the market. Traders look for price breakouts above resistance levels or below support levels, indicating a potential continuation of the current trend.

Trendline Breakout

This strategy focuses on trading breakouts that occur when price breaks above or below a trendline. Traders draw trendlines based on the highs or lows of price movements and enter trades when price breaks through the trendline, signaling a potential trend reversal, consolidation draws or continuation.

Price Action Breakout

This strategy relies on analyzing price patterns and candlestick formations to identify breakout opportunities. Traders look for specific price patterns such as triangles, rectangles, or flags, and enter trades when price breaks out of these patterns, indicating a potential shift in market sentiment.

News Breakout

This strategy involves trading breakouts that occur following major news releases or economic events. Traders monitor economic calendars, markets spend and look for significant news releases that could potentially cause increased volatility and price breakouts. They enter trades based on the direction of the breakout and the impact of the news on the market. Also, watch out when a company’s shares report are released and the stock market is bullish.

False Breakout

This strategy focuses on trading breakouts that initially appear to be genuine but then fail to sustain the momentum. Traders look for situations where price breaks above or below key levels but quickly reverses back within the range. They take advantage of these false breakouts by entering trades in the opposite direction and aiming to profit from the subsequent reversal.

These breakout strategies can be used by traders to capture potential profitable trading opportunities in the financial markets. It’s important to note that each strategy has its own set of rules, risk management techniques, and entry/exit criteria. long-term and short-term traders often combine multiple strategies or use additional technical indicators to confirm breakouts and increase the probability of successful trades.

Technical Analysis Tools

Moving Averages

Moving averages are used to smooth out price data and identify trends. They calculate the average price level over a specified number of periods and are commonly used to determine support and resistance levels and generate buy or sell signals.

Bollinger Bands

Bollinger bands consist of a middle band (usually a simple moving average) and two outer bands that are based on standard deviations. They provide a visual representation of price volatility and can be used to identify potential price reversals or breakouts and other asset.

Relative Strength Index (RSI)

The RSI is a momentum oscillator that measures the strength and speed of price movements. It ranges from 0 to 100 and is used to identify overbought and oversold conditions in the market, as well as potential trend reversals.

Fibonacci Retracement

Fibonacci retracement is a technical analysis tool that uses horizontal lines to indicate areas of support or resistance at the key Fibonacci levels before the price continues in the original direction. These levels are determined by the Fibonacci sequence and ratios.

Ichimoku Cloud

The Ichimoku Cloud is a comprehensive technical analysis tool that provides information about support and resistance levels, trend direction, and momentum. It consists of several components, including a cloud (Kumo), a conversion line (Tenkan-sen), a base line (Kijun-sen), a lagging span (Chikou Span), and a leading span (Senkou Span).

Candlestick Charts

Candlestick charts are a popular charting technique used in technical analysis. They display price data for a specific time period in a visual format that resembles candlesticks. Candlestick patterns are used to identify potential reversals, continuation patterns, and other market signals.

These technical analysis tools can be used by traders and investors to analyze price movements, identify trends, and make informed trading decisions. It’s important to note that no single tool or indicator guarantees accurate predictions, and it’s often beneficial to use multiple tools in combination to confirm signals and increase the probability of successful trades.

While technical analysis is a valuable tool, it’s important to remember that it’s not foolproof. That’s why we always recommend supplementing it with other forms of analysis and risk management techniques.

Advice on How to Trade Forex Consolidation

There are different ways to trade a consolidation zone in forex. Some traders advise carefully considering whether trading is appropriate for you based on your personal circumstances, as forex trading involves risks.

Trading consolidations occur when the price moves sideways in a lack of trend. It signifies indecision among market participants and often precedes a breakout or breakdown.


To trade consolidation in forex, it is important to first identify the support and resistance levels. These levels can be identified by analyzing the price action. Traders can then look for breakouts or breakdowns from these levels to enter trades.


A common rule of thumb in trading consolidation patterns is to aim for at least a 2:1 risk-reward ratio, where the potential profit is twice as large as the possible loss. Various technical indicators and tools can be used in conjunction with consolidation patterns to enhance trading decisions.

In forex trading, consolidation refers to an asset oscillating between well-defined levels of support and resistance. It is often seen as market indecisiveness and usually ends when the price breaks above or below the trading pattern.

Takeaway

Unlocking the Secrets to Successful Forex Trading During Consolidation requires specific strategies and techniques. Here are some key points to consider:

Wait for the Moment of Breakout

Timing is crucial when trading forex during consolidation. It’s important to wait for a clear breakout before entering a trade. This occurs when the price breaks above or below the consolidation range, indicating a potential trend continuation or reversal. Patience is key in waiting for the right moment to make your move.

Harness the Power of Technical Indicators

Utilizing technical indicators can provide valuable insights and help you make informed trading decisions. Indicators such as moving averages, Bollinger bands, and relative strength index (RSI) can assist in identifying potential entry and exit points during consolidation periods.

Keep a Close Eye on Key Levels

Monitoring support and resistance levels is vital during consolidation. These levels act as boundaries for price movement and can provide profitable trading opportunities. Pay attention to how the price reacts near these levels and look for breakouts or bounces to enter trades.

Cultivate the Virtue of Patience

Consolidation periods can test traders’ patience as the market lacks clear direction. Avoid jumping into trades out of boredom or frustration. Wait for strong signals and confirmation before taking action. Being patient can lead to more significant wins.

Safeguard Your Investments with Risk Management

Risk management is crucial in any trading strategy, including during consolidation. Set appropriate stop-loss orders to limit potential losses and protect your capital. Proper risk management helps maintain consistency and optimize trading performance.

Conclusion

Trading consolidations in the forex market can be challenging because of the risk of false breakouts. One important concept to consider is to avoid getting caught in false breakouts, which can lead to losses. It’s recommended to use strategies that help identify high probability breakouts.


Disclaimer:

All information has been prepared by TraderFactor or partners. The information does not contain a record of TraderFactor or partner’s prices or an offer of or solicitation for a transaction in any financial instrument. No representation or warranty is given as to the accuracy or completeness of this information. Any material provided does not have regard to the specific investment objective and financial situation of any person who may read it. Past performance is not a reliable indicator of future performance. 

FOLLOW US

Author

  • Zahari Rangelov

    Zahari Rangelov is an experienced professional Forex trader and trading mentor with knowledge in technical and fundamental analysis, medium-term trading strategies, risk management and diversification. He has been involved in the foreign exchange markets since 2005, when he opened his first live account in 2007. Currently, Zahari is the Head of Sales & Business Development at TraderFactor's London branch. He provides lectures during webinars and seminars for traders on topics such as; Psychology of market participants’ moods, Investments & speculation with different financial instruments and Automated Expert Advisors & signal providers. Zahari’s success lies in his application of research-backed techniques and practices that have helped him become a successful forex trader, a mentor to many traders, and a respected authority figure within the trading community.