The Australian Dollar (AUD) has recovered some of its losses against the US Dollar (USD), largely due to a weaker dollar. However, the overall downtrend is still intact. The mixed data coming out of Australia is now shifting focus to the upcoming US housing and jobless claims figures. It’s predicted that the AUD/USD pair will encounter resistance at 0.6545 and 0.6640.
Earlier Predictions
The Australian Dollar (AUD) is currently trading near 0.6560 against the US Dollar (USD), with an immediate support level at 0.6550. Intraday bias in AUD/USD remains on the upside, as the rise from 0.6269 is in progress towards a resistance of 0.6894. Market analysts are closely observing the AUD/USD pair, predicting that a break below the support level could significantly influence the currency pair’s movement.
However, there is a neutral sentiment regarding the long-term outlook, suggesting the AUD/USD pair has good chances of returning to the 1:1 ratio. Today’s intraday recommendation is to buy at an entry price of 0.6530 with target and take profit levels at 0.6580 and 0.6600 respectively. This intraday prediction is supported by the Relative Strength Index (RSI), which shows an upside momentum.
AUDUSD Daily Chart
Australian Economic Indicators: A Mixed Bag
Australian economic data presents a mixed picture. January saw Consumer Inflation Expectations remain stable at 4.5%, while the number of employed individuals unexpectedly fell, indicating potential weaknesses in the labour market.
Chinese Macroeconomic Data Influence on AUD
China’s GDP Growth Falls Short, Impacting the Aussie
Data released on Wednesday revealed that China’s GDP growth rate for 2023 was 5.2%, falling short of the anticipated 5.3%. In addition, retail sales underperformed, sparking worries about a slow post-pandemic recovery. As China is Australia’s primary trading partner, these factors contribute to the pressure on the Aussie.
Reviewing Australian Economic Data for December 2023
According to the latest reports, the Australian economy experienced mixed outcomes in December 2023. The unemployment rate remained steady, while employment figures saw fluctuations. Here’s a detailed look at the economic indicators for Australia in December 2023.
Employment and Unemployment Rates
In trend terms, the unemployment rate in Australia was stable at 3.8%, while the participation rate remained unchanged at 67.0%. The number of employed individuals increased, reaching 14,246,000. However, the employment to population ratio saw a slight decline, dropping to 64.4%. The underemployment rate held steady at 6.5%, and there was a decrease in monthly hours worked, which fell to 1,928 million.
In seasonally adjusted terms, the unemployment rate held firm at 3.9% in December 2023. The participation rate experienced a slight downturn, decreasing to 66.8%, and employment figures also dropped to 14,201,100. The employment to population ratio declined to 64.2%, and the number of monthly hours worked reduced to 1,926 million.
Full-time and Part-time Employment
In terms of full-time and part-time employment in December 2023, there were notable changes. Full-time employment decreased by 106,600, bringing the total number of full-time employees to 9,791,200 people. In contrast, part-time employment saw an increase, with an additional 41,400 people finding part-time work, bringing the total to 4,409,900 people.
All information has been prepared by TraderFactor or partners. The information does not contain a record of TraderFactor or partner’s prices or an offer of or solicitation for a transaction in any financial instrument. No representation or warranty is given as to the accuracy or completeness of this information. Any material provided does not have regard to the specific investment objective and financial situation of any person who may read it. Past performance is not a reliable indicator of future performance.
Zahari Rangelov is an experienced professional Forex trader and trading mentor with knowledge in technical and fundamental analysis, medium-term trading strategies, risk management and diversification. He has been involved in the foreign exchange markets since 2005, when he opened his first live account in 2007. Currently, Zahari is the Head of Sales & Business Development at TraderFactor's London branch. He provides lectures during webinars and seminars for traders on topics such as; Psychology of market participants’ moods, Investments & speculation with different financial instruments and Automated Expert Advisors & signal providers. Zahari’s success lies in his application of research-backed techniques and practices that have helped him become a successful forex trader, a mentor to many traders, and a respected authority figure within the trading community.
Do you want to make smarter trades in the Forex market? If so, it’s important to understand what a pip is and how they affect your profits. A pip is a unit of measurement within the Foreign Exchange (Forex) markets that shows traders and investors the value gained or lost when trading different currency pairs.
This blog post will explain everything you need to know about pips, including where they come from, how to calculate them, and how understanding their role can help improve trading performance.
Keep reading to boost your forex knowledge and make more informed forex investing decisions. Read on.
Understand the Basics of a Pip in Forex Trading
When it comes to trading, every pip counts! This miniature measurement represents the tiniest change in the value of currency pairs. Depending on its placement, one pip could equal 1, 10, or even 100 points.
Curious for more?
Trading FX involves a lot of jargon, so it’s important to take the time to understand some basic concepts like a pip. A pip is a commonly used unit for measuring differentials in currency prices. Specifically, it’s the differences between the bid and ask price for a particular currency pair.
The size of a pip is determined by the specific currency pair being traded, but it always has the same value regardless of how many lots you are trading. That way, investors can know exactly how much they’ve profited or lost on each trade.
What is a Pipette?
Pipettes in Forex trading, also known as fractional pips, is a term used to represent 0.00001 of a unit of a given currency pair. This small amount makes it easier for traders to take more precise risk management positions and to enjoy greater accuracy when scalping (small short-term trades).
Pipettes (points) allow traders to enter into specific positions that weren’t easily achievable in the past due to limited precision when making trades. The extra numerical values allow for more granular movement in order to hedge against small changes in prices.
Pipettes are available primarily through ECN forex brokers and can be especially useful for intraday traders who prefer high precision when trading at very short-term timescales.
How Does a Pip Affect Your Profits?
Pips can significantly impact your profits or losses in the forex market because they represent the smallest increment by which the value of a currency pair can change.
For example, if you are long (meaning you have bought) a currency pair, a one pip increase in the exchange rate would result in a profit, while a one pip decrease would result in a loss.
Similarly, if you are short (meaning you have sold) a currency pair, a one pip increase in the exchange rate would result in a loss, while a one pip decrease would result in a profit.
The impact of pips on your profits or losses can be calculated by using a pip value calculator. It takes into account the size of your trade, the exchange rate of the currency pair, and the size of the pip.
This will give you the pip’s value in the currency you are trading, which can then be used to calculate your profit or loss.
It is important to note that the value of a pip can vary depending on the currency pair that you are trading and the size of your trade.
For example, a one pip change in the exchange rate of a major currency pair like EUR/USD may have a different value than a one pip change in the exchange rate of a minor or exotic currency pair.
How Are Pips Calculated in Forex Trading?
In forex trading, the value of a pip is usually calculated in the base currency of the currency pair that you are trading.
The base currency is the first currency in the pair, and the quote currency pair is the second currency in the pair and is also known as the counter currency.
When calculating the value of a pip:
Determine the exchange rate for the currency pair. For example, if the exchange rate ratio for the EUR/USD currency pair is 1.2000, this means that one Euro is worth 1.2000 US dollars.
Determine the size of your trade. This is the number of units of the base currency that you are buying or selling. For example, if you are buying 10,000 trading units of the base currency, this is known as a “standard lot.”
Calculate the value of a pip. To do this, you will need to multiply the size of your trade by the exchange rate and the pip value, which is usually 0.0001. For example, if you are trading a standard lot of EUR/USD with an exchange rate of 1.2000, the value of a pip would be calculated as follows:
(10,000 units x 1.2000) x 0.0001 = $1.20
This means that a one pip change in the exchange rate of the EUR/USD currency pair would result in a profit or loss of $1.20, depending on whether you are long (meaning you have bought) or short (meaning you have sold) the currency pair.
It is important to note that the value of a pip can vary depending on the currency pair that you are trading and the size of your trade.
For example, if you are trading a currency pair with a low exchange rate, the value of a pip may be smaller than if you are trading a currency pair with a high exchange rate.
In addition, the value of a pip can be different for different sizes of trades, such as;
Mini lots
Micro lots
Standard lots.
A pip calculator enables you to calculate the value of a pip in different accounts depending on the size of your trade.
What are the Different Types of Forex Pips and their Advantages?
There are several different types of pips that are used in forex trading.
Standard Pips
These are the most commonly used pips in the forex market and are usually measured in the fourth decimal place of an exchange rate.
For example, if the exchange rate for the GBP/USD currency pair is 1.2000, a change of 0.0001 in the exchange rate would be equal to one standard pip.
Mini Pips
Mini pips are similar to standard pips but are measured in the fifth decimal place of an exchange rate. For example, if the exchange rate for the GBP/USD currency pair is 1.20000, a change of 0.00001 in the exchange rate would be equal to one mini pip.
Micro Pips
Micro pips are smaller than mini pips, measured in the sixth decimal place of an exchange rate.
For example, if the exchange rate for the EUR/USD currency pair is 1.200000, a change of 0.000001 in the exchange rate would be equal to one micro pip.
The advantage of using mini or micro pips is that they allow traders to take advantage of the value of each pip move in the forex market.
However, they also carry a higher level of risk, as the value of a mini or micro pip is much smaller than the value of a standard pip.
Take Away
Pips are used to calculate how much profit you’ve made on a trade based on the ‘pip’ or ‘point’ movement of the currency price. Most forex brokers’ trading platforms will automatically calculate your profits and losses into pips.
Hence, you can easily see how much money you’ve made or lost on a trade without making any calculations.
When calculating profit and loss from pips alone, always remember to factor in the spread, as this will be deducted from your total profit (or added to your loss).
CTA
Forex trading is a good way of making profits as long as you understand what it’s all about, starting with knowing how to calculate pips. So, what are you waiting for? Get started today by reading our beginner guides in theForex Education Section
All information has been prepared by TraderFactor or partners. The information does not contain a record of TraderFactor or partner’s prices or an offer of or solicitation for a transaction in any financial instrument. No representation or warranty is given as to the accuracy or completeness of this information. Any material provided does not have regard to the specific investment objective and financial situation of any person who may read it. Past performance is not a reliable indicator of future performance.
Zahari Rangelov is an experienced professional Forex trader and trading mentor with knowledge in technical and fundamental analysis, medium-term trading strategies, risk management and diversification. He has been involved in the foreign exchange markets since 2005, when he opened his first live account in 2007. Currently, Zahari is the Head of Sales & Business Development at TraderFactor's London branch. He provides lectures during webinars and seminars for traders on topics such as; Psychology of market participants’ moods, Investments & speculation with different financial instruments and Automated Expert Advisors & signal providers. Zahari’s success lies in his application of research-backed techniques and practices that have helped him become a successful forex trader, a mentor to many traders, and a respected authority figure within the trading community.
The Euro is making a recovery against the US Dollar, heading towards the 1.0900 mark on Wednesday morning.
The recovery is due to the Dollar taking a breather amid a risk-off mood and the hawkish stance of the European Central Bank (ECB). The next focal point in the market is the US Retail Sales data.
Pound Sterling Bounces Back Post UK Inflation Data
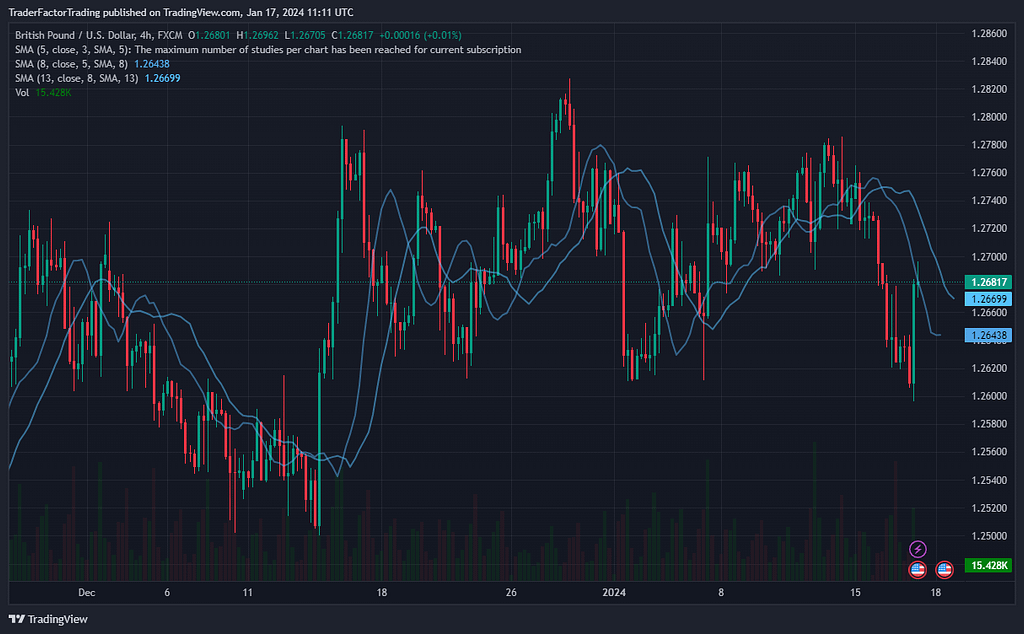
The Pound Sterling (GBP) is experiencing a rebound, moving above the 1.2650 mark. This surge comes on the heels of an unexpected rise in the headline UK annual Consumer Price Index (CPI) inflation data. This hot off the press inflation data has squashed hopes of aggressive interest rate cuts by the Bank of England (BoE) this year, thus giving the Pound Sterling a lift.
GBPUSD DAILY CHART
GBP/JPY Crosses the 187.00 Mark Following Strong UK Economic Data
The GBP/JPY pair continues its upward journey for the third consecutive day, trading around 187.10 during the European session on Wednesday. This momentum is driven by solid economic data from the UK released on Wednesday, which supports the GBP/JPY cross.
GBP/JPY Daily Chart
The chances of an early rate cut by the BoE have lessened due to increased price pressures, possibly leading the central bank to adopt a more cautious approach to manage inflation and maintain price stability.
UK Inflation Data Surpasses Expectations
UK’s year-over-year CPI rose by 4.0%, surpassing the previous 3.9% and the expected 3.8% reading in December. The monthly CPI also increased by 0.4%, compared to the expected 0.2%, reversing from the previous decline of 0.2%. Meanwhile, the annual Core CPI remained consistent at 5.1%, against the market expectation of 4.9%.
Japanese Yen Continues to Decline Against the British Pound
The Japanese Yen (JPY) continues to lose ground against the British Pound (GBP) due to falling consumer prices in Tokyo and weak labor data released last week. This has reinforced expectations that the Bank of Japan (BoJ) will delay its plan to shift away from its extremely accommodative monetary policy stance.
Gold Price Maintains Selling Pressure, Defends 50-day SMA Support
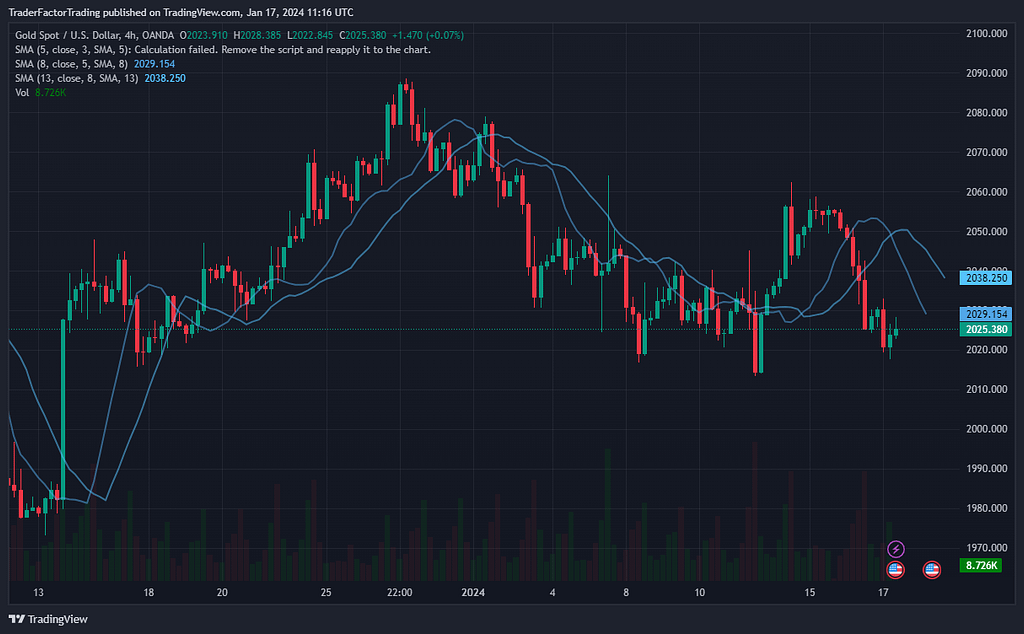
The price of gold (XAU/USD) continues to face selling pressure for the second consecutive day, maintaining its offered tone through the early part of the European session on Wednesday. However, the precious metal defends the 50-day Simple Moving Average (SMA) support and currently trades around the $2,024-2,025 area, just above the weekly low reached in the last hour.
XAUUSD Daily Chart
The overnight remarks by Federal Reserve’s Christopher Waller have led investors to further trim their bets for an early rate cut by the US central bank. This supports the elevated US Treasury bond yields, which lift the US Dollar to over a one-month peak and undermine the non-yielding yellow metal.
UK Consumer Price Inflation Overview: December 2023
In the world of economic indicators, consumer price inflation is a key gauge of price levels and economic health. In the UK, December 2023 brought some interesting shifts in these metrics.
Indicator
Rate (%)
Change from Previous Month
Consumer Prices Index (CPI)
4.0
Up from 3.9%
Consumer Prices Index including owner occupiers’ housing costs (CPIH)
4.2
No Change
Core CPIH (excluding energy, food, alcohol, and tobacco)
5.2
No Change
Core CPI (excluding energy, food, alcohol, and tobacco)
5.1
No Change
CPI Goods Annual Rate
1.9
Down from 2.0%
CPI Services Annual Rate
6.4
Up from 6.3%
CPIH Goods Annual Rate
1.9
Down from 2.0%
CPIH Services Annual Rate
6.0
No Change
The rise in the CPI to 4.0% marked the first increase since February 2023. On a monthly basis, both the CPI and CPIH rose by 0.4%, matching the rate of increase seen in December 2022.
The largest upward pressure on the monthly change in both CPIH and CPI annual rates came from alcohol and tobacco. Conversely, the most significant downward pressure came from food and non-alcoholic beverages.
As for the core indices, which exclude more volatile components like energy, food, alcohol, and tobacco, the annual rates remained steady in December 2023 at 5.2% for CPIH and 5.1% for CPI. The CPIH goods annual rate slowed slightly, while the CPI services annual rate saw a slight uptick.
The overall picture painted by these statistics is one of stable inflation with some sectors experiencing more price pressure than others source.
Disclaimer:
All information has been prepared by TraderFactor or partners. The information does not contain a record of TraderFactor or partner’s prices or an offer of or solicitation for a transaction in any financial instrument. No representation or warranty is given as to the accuracy or completeness of this information. Any material provided does not have regard to the specific investment objective and financial situation of any person who may read it. Past performance is not a reliable indicator of future performance.
Zahari Rangelov is an experienced professional Forex trader and trading mentor with knowledge in technical and fundamental analysis, medium-term trading strategies, risk management and diversification. He has been involved in the foreign exchange markets since 2005, when he opened his first live account in 2007. Currently, Zahari is the Head of Sales & Business Development at TraderFactor's London branch. He provides lectures during webinars and seminars for traders on topics such as; Psychology of market participants’ moods, Investments & speculation with different financial instruments and Automated Expert Advisors & signal providers. Zahari’s success lies in his application of research-backed techniques and practices that have helped him become a successful forex trader, a mentor to many traders, and a respected authority figure within the trading community.