

Learn the best forex breakout strategy with real chart examples, breakout confirmation techniques, ICT concepts, and risk management for consistent trading.
-TraderFactor.png)
Table of Contents
Key Takeaways
- A forex breakout strategy aims to capture momentum after price moves beyond significant support or resistance.
- High-probability breakouts usually occur after periods of consolidation where liquidity has accumulated.
- Not every breakout is genuine—confirmation through market structure and liquidity analysis is essential.
- Smart Money Concepts such as BOS, CHOCH, MSS, Order Blocks, and Fair Value Gaps can help filter false breakouts.
- Breakout strategies can be applied across forex pairs, commodities like gold, indices, and cryptocurrencies.

Forex Breakout Strategy Explained: Best Entry, Exit & Risk Management (2026 Guide)
A forex breakout strategy is one of the most widely used trading approaches because it allows traders to enter the market when price breaks out of a well-defined range, support level, or resistance zone. Strong breakouts often signal the beginning of a new trend, creating opportunities for both short-term and long-term traders.
However, not every breakout leads to a profitable trade. Many apparent breakouts are simply liquidity grabs or false breakouts designed to trigger stop-loss orders before price reverses. This is why experienced traders rarely trade a breakout based solely on a candle closing above resistance or below support.
Modern traders combine traditional price action with Smart Money Concepts (SMC) and ICT trading principles to distinguish genuine institutional breakouts from fake moves. They look for confluences such as Break of Structure (BOS), Change of Character (CHOCH), Market Structure Shift (MSS), Fair Value Gaps (FVGs), Order Blocks, and liquidity sweeps before committing to a position.
In this comprehensive guide, you’ll learn:
- What a forex breakout strategy is
- Why breakouts happen
- How to identify high-probability breakout setups
- The difference between true and false breakouts
- How institutions trade breakouts
- ICT and Smart Money breakout concepts
- Risk management techniques
- Real chart examples
- Common breakout trading mistakes to avoid
Whether you trade EUR/USD, GBP/USD, USD/JPY, XAU/USD (Gold), NASDAQ, Bitcoin, or other financial markets, these breakout concepts apply across multiple timeframes and asset classes.

Quick Answer
A forex breakout strategy is a trading method where traders enter after price breaks above resistance or below support with strong momentum and confirmation. Professional traders improve breakout accuracy by combining price action with liquidity analysis, BOS, CHOCH, MSS, volume, and risk management rather than trading every breakout blindly.
What Is a Forex Breakout Strategy?
A forex breakout strategy is a trading technique that aims to capture significant price movements after the market breaks through an important support or resistance level.
Markets spend much of their time moving sideways as buyers and sellers remain balanced. During these periods, orders accumulate around key price levels. Once one side gains control, price often breaks out of the range, triggering stop-losses, pending orders, and fresh institutional positions. This surge in order flow frequently results in strong directional momentum.
Breakout traders seek to enter these moves early, aiming to profit from the expansion in volatility that follows.

Definition Box
Forex Breakout Strategy Definition
A forex breakout strategy involves entering a trade after price moves beyond a significant support or resistance level with sufficient confirmation, anticipating continued momentum in the breakout direction.
How Breakouts Form
A typical breakout follows four stages:
- Trend or consolidation – The market pauses after a move or trades within a defined range.
- Liquidity builds – Stop-losses and pending orders accumulate above resistance and below support.
- Breakout occurs – Price breaks through the level with increased momentum.
- Continuation or rejection – Price either continues trending or reverses, creating a false breakout.
Understanding these stages helps traders avoid chasing weak moves and focus on higher-probability opportunities.
Types of Forex Breakouts
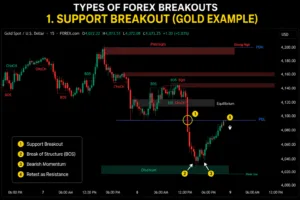
1. Support Breakout
A support breakout occurs when price closes below a significant support level, indicating that sellers have overwhelmed buyers. This often signals the start of a bearish trend or the continuation of an existing downtrend.
Common confirmations:
- Strong bearish candle close
- Break of Structure (BOS)
- Rising bearish momentum
- Retest of broken support as resistance
- Increased trading volume (where available)

2. Resistance Breakout
A resistance breakout occurs when buyers push price above a key resistance level, often initiating a bullish trend.
Professional traders typically wait for a candle close above resistance followed by confirmation rather than entering on the initial spike.
Common confirmations:
- Bullish BOS
- Strong candle body
- Higher highs and higher lows
- Retest of resistance as new support
- Fair Value Gap supporting momentum

3. Range Breakout
Markets frequently consolidate within a trading range before expanding into a new trend. A range breakout occurs when price escapes this consolidation with conviction.
These setups are common before:
- London Open
- New York Open
- High-impact economic news
- Central bank announcements
4. Trendline Breakout
Trendline breakouts occur when price breaks a well-respected ascending or descending trendline.
While useful, trendline breaks should not be traded in isolation. Combining them with market structure, liquidity analysis, and confirmation significantly improves reliability.

Why Forex Breakouts Happen
Breakouts are driven by changes in supply and demand, often amplified by institutional order flow. Some of the most common catalysts include:
- High-impact economic news (e.g., Non-Farm Payrolls, CPI, FOMC decisions)
- Central bank policy announcements
- Session openings (London and New York)
- Institutional accumulation and distribution
- Liquidity sweeps around previous highs and lows
- Trend continuation after consolidation
When these factors align, the market can transition rapidly from low volatility to high volatility, creating the strong directional moves that breakout traders seek.
What Causes Forex Breakouts?
Understanding why breakouts happen is just as important as knowing how to trade them. Most beginner traders believe price breaks through support or resistance because buyers or sellers suddenly become stronger. In reality, professional traders know that breakouts are driven by institutional order flow, liquidity, volatility, and market psychology.
Breakouts occur when a large imbalance develops between buying and selling pressure. This imbalance causes price to escape consolidation and begin a new directional move.

Quick Answer
Forex breakouts occur when institutional buying or selling pressure overwhelms the orders sitting around key support or resistance levels. Liquidity, economic news, trading sessions, and market structure shifts are the main drivers behind strong breakout moves.
1. Liquidity Accumulation
One of the biggest reasons breakouts occur is liquidity.
Large financial institutions cannot execute massive orders instantly without significantly moving the market. Instead, they often wait until sufficient buy-stop and sell-stop orders accumulate around obvious technical levels.
These liquidity pools are commonly found:
- Above resistance
- Below support
- Above equal highs (EQH)
- Below equal lows (EQL)
- Previous Day High (PDH)
- Previous Day Low (PDL)
- Weekly Highs and Lows
- Psychological round numbers
Once enough liquidity has built up, institutions execute large positions, often triggering explosive breakout moves.

Definition Box
Liquidity refers to clusters of pending orders and stop-loss orders that accumulate around important price levels. Institutional traders frequently target these areas before a sustained market move develops.
2. Institutional Order Flow
Retail traders move very little market volume.
Banks
Hedge funds
Investment firms
Central banks
Prop trading firms
are responsible for most large market movements.
When institutions begin buying or selling aggressively, price often breaks beyond important technical levels.
This institutional participation explains why genuine breakouts usually occur with:
- Large candle bodies
- Strong momentum
- Consecutive candles
- Increasing volatility

Key Characteristics
✅ Strong displacement
✅ Minimal pullbacks
✅ Break of Structure (BOS)
✅ Increased volatility
3. Market Structure Shift (MSS)
Professional traders rarely buy the first breakout candle.
Instead, they wait for confirmation that market structure has shifted.
A Market Structure Shift (MSS) occurs when buyers or sellers successfully take control after liquidity has been swept.
For example:
Price makes lower highs.
↓
Liquidity is swept.
↓
Strong bullish candle forms.
↓
Higher high develops.
↓
Bullish MSS confirmed.
This significantly improves breakout quality.

4. Break of Structure (BOS)
A breakout becomes much more reliable after a Break of Structure (BOS).
A BOS confirms that one side of the market has gained control.
Bullish BOS
Previous swing high breaks.
Bearish BOS
Previous swing low breaks.
Professional traders often wait for BOS before entering breakout trades because it reduces the chances of trading a fake breakout.
Definition Box
Break of Structure (BOS) occurs when price decisively breaks a previous swing high or swing low, confirming trend continuation.
5. Change of Character (CHOCH)
Sometimes the market does not continue its existing trend.
Instead, it begins reversing.
This transition is called Change of Character (CHOCH).
CHOCH often appears:
- Before major reversals
- Before breakout failures
- After liquidity sweeps
- Near premium or discount zones
Recognizing CHOCH helps traders avoid entering breakouts that are likely to fail.

6. Volatility Expansion
Markets alternate between periods of:
- Low volatility
- High volatility
Consolidation usually represents low volatility.
Breakouts occur during volatility expansion.
Common catalysts include:
- London Open
- New York Open
- CPI
- NFP
- FOMC
- Interest Rate Decisions
- Geopolitical events
The greater the volatility expansion, the stronger the potential breakout.

7. Trading Sessions
Some sessions naturally produce stronger breakouts.
| Session | Breakout Strength |
|---|---|
| London Open | ⭐⭐⭐⭐⭐ |
| New York Open | ⭐⭐⭐⭐⭐ |
| London–New York Overlap | ⭐⭐⭐⭐⭐ |
| Asian Session | ⭐⭐☆☆☆ |
The London and New York sessions account for most institutional activity, making them the most reliable periods for breakout trading.
8. High-Impact News
Economic releases can rapidly increase volatility and trigger breakouts.
Examples include:
- CPI
- Non-Farm Payrolls (NFP)
- FOMC Decisions
- Federal Reserve speeches
- ECB meetings
- Bank of England decisions
- GDP
- Employment reports
While these events create opportunities, they can also produce false breakouts due to sharp initial volatility.
Why Many Breakouts Fail
Not every breakout develops into a trend.
False breakouts often occur because institutions intentionally push price beyond obvious levels to trigger stop-losses before reversing.
Common warning signs include:
- Weak breakout candle
- Long upper or lower wick
- No BOS
- No displacement
- Low momentum
- Immediate rejection back into the range
- Breakout during low-liquidity sessions
Waiting for confirmation rather than entering immediately can significantly improve trade quality.

How to Identify High-Probability Forex Breakouts
Not every breakout deserves to be traded. One of the biggest mistakes beginner traders make is entering immediately after price moves beyond support or resistance. Professional traders, on the other hand, wait for multiple confirmations before risking capital.
A high-probability breakout occurs when several technical and institutional factors align, increasing the likelihood that price will continue in the breakout direction rather than reverse.

Quick Answer
The best forex breakouts combine strong market structure, liquidity, momentum, and confirmation. Rather than trading every breakout, professional traders look for confluences such as BOS, liquidity sweeps, volume, Fair Value Gaps (FVGs), Order Blocks, and successful retests.
The 8-Step Breakout Checklist
Before taking any breakout trade, ask yourself these questions:
✅ Is the market trending?
✅ Is there sufficient liquidity near the breakout level?
✅ Has price broken market structure (BOS)?
✅ Was liquidity swept before the breakout?
✅ Is there strong displacement?
✅ Is there an Order Block or FVG supporting the move?
✅ Has price successfully retested the breakout level?
✅ Does the trade offer at least a 1:2 risk-to-reward ratio?
The more boxes you can tick, the higher the quality of the setup.
1. Trade With the Higher-Timeframe Trend
One of the simplest ways to improve breakout accuracy is to trade in the direction of the higher-timeframe trend.
For example:
- Weekly trend: Bullish
- Daily trend: Bullish
- H4 trend: Bullish
In this case, bullish breakouts on the 15-minute or 1-hour chart generally have a higher probability than bearish breakouts.
Trading against the higher-timeframe trend often results in weaker follow-through and more false breakouts.

2. Look for Liquidity Before the Breakout
Institutions often seek liquidity before initiating a major move.
Ask yourself:
- Are there equal highs (EQH)?
- Are there equal lows (EQL)?
- Is price approaching the Previous Day High (PDH)?
- Is price approaching the Previous Day Low (PDL)?
- Are there clustered stop-losses nearby?
These liquidity pools often act as fuel for the breakout.
Definition Box
Liquidity Sweep: A temporary move above or below a key level that triggers stop-loss orders before price reverses or accelerates in the intended direction.
3. Wait for a Strong Breakout Candle
The breakout candle itself provides valuable information.
Characteristics of a Strong Breakout Candle
✔ Large candle body
✔ Small wick
✔ Strong close beyond support or resistance
✔ Clear momentum

Characteristics of a Weak Breakout Candle
❌ Long wick
❌ Small body
❌ Closes back inside the range
❌ Immediate rejection
A strong close outside the breakout level is generally a better confirmation than a candle that only briefly spikes beyond it.
4. Confirm With Break of Structure (BOS)
A breakout becomes more reliable when it also breaks market structure.
For a bullish breakout:
Higher High → BOS
For a bearish breakout:
Lower Low → BOS
A breakout without BOS is more likely to fail.

5. Watch for Fair Value Gaps (FVGs)
Fair Value Gaps often appear after strong institutional buying or selling.
Instead of chasing the breakout, many traders wait for price to retrace into the FVG before entering.
Advantages include:
- Better entry price
- Smaller stop loss
- Improved risk-to-reward ratio
6. Use Order Blocks as Confirmation
Institutional Order Blocks frequently become launch points for strong breakouts.
For bullish setups:
Price breaks out
↓
Returns to bullish Order Block
↓
Continues higher
For bearish setups:
Price breaks down
↓
Retests bearish Order Block
↓
Continues lower

7. Wait for the Retest
One of the most effective breakout techniques is waiting for price to return to the breakout level.
Instead of entering immediately:
Breakout
↓
Retest
↓
Confirmation candle
↓
Entry
This approach helps filter false breakouts and often provides a tighter stop-loss.

8. Volume Confirmation (Where Available)
While spot forex lacks centralized volume, traders using futures, CFDs, or assets like stocks and cryptocurrencies can use volume to validate breakouts.
A genuine breakout is often accompanied by:
- Rising volume
- Strong momentum
- Institutional participation
Weak volume may indicate a false breakout.
High-Probability Breakout Checklist
| Confirmation | Why It Matters |
|---|---|
| Higher-timeframe trend | Aligns with market direction |
| Liquidity sweep | Indicates institutional activity |
| Strong breakout candle | Shows conviction |
| Break of Structure (BOS) | Confirms market control |
| Fair Value Gap (FVG) | Offers high-quality entries |
| Order Block | Institutional support/resistance |
| Retest | Reduces false breakout risk |
| Strong momentum | Increases continuation probability |
Common Mistakes Traders Make
Avoid these common errors:
- Entering before the candle closes
- Ignoring the higher-timeframe trend
- Trading during low-liquidity sessions
- Chasing overextended breakout candles
- Ignoring nearby liquidity zones
- Forgetting to wait for BOS or MSS confirmation
- Using excessively tight stop-losses
- Trading without a predefined risk-to-reward ratio
Pro Tip
The best breakout trades usually occur after liquidity has been swept, market structure has shifted, and price confirms the move with a Break of Structure (BOS). Combining these concepts with Fair Value Gaps and Order Blocks can significantly improve trade quality compared to trading breakouts based solely on support and resistance.

False Breakout vs Genuine Breakout: How to Tell the Difference
One of the biggest challenges in breakout trading is distinguishing a genuine breakout from a false breakout, also known as a fakeout. Many traders enter the market the moment price moves above resistance or below support, only to watch it reverse shortly afterward.
False breakouts are common because institutional traders often push price beyond obvious levels to trigger retail stop-losses and pending orders before moving the market in the intended direction.
Learning to identify these traps can significantly improve your trading consistency.
Quick Answer
A genuine breakout is supported by strong momentum, a Break of Structure (BOS), displacement, and sustained buying or selling pressure. A false breakout typically lacks follow-through, quickly returns inside the range, and often occurs after a liquidity sweep.
What Is a False Breakout?
A false breakout occurs when price briefly moves above resistance or below support but fails to continue in that direction. Instead, it quickly reverses back into the previous trading range.
This movement often traps breakout traders who entered too early.
False breakouts usually happen around:
- Equal Highs (EQH)
- Equal Lows (EQL)
- Previous Day High (PDH)
- Previous Day Low (PDL)
- Weekly Highs and Lows
- Major support and resistance zones

What Is a Genuine Breakout?
A genuine breakout occurs when price breaks through an important level with strong institutional participation and continues moving in the breakout direction.
Instead of immediately reversing, price usually:
- Closes decisively outside the range
- Breaks market structure
- Creates displacement
- Holds above or below the breakout level
- Continues making higher highs or lower lows
Professional traders prefer these setups because they indicate sustained buying or selling pressure.
False Breakout vs Genuine Breakout
| False Breakout | Genuine Breakout |
|---|---|
| Weak candle close | Strong candle close |
| Long rejection wick | Large candle body |
| Returns inside the range | Holds outside the range |
| No Break of Structure (BOS) | Clear BOS confirmation |
| Low momentum | Strong displacement |
| Often traps retail traders | Supported by institutional buying or selling |
| Usually fails within a few candles | Continues making new highs or lows |
Signs of a Genuine Breakout
Look for these confirmations before entering a breakout trade:
- Strong candle body closing beyond the breakout level
- Break of Structure (BOS)
- Market Structure Shift (MSS)
- Liquidity sweep before the breakout
- Fair Value Gap (FVG)
- Rising momentum
- Successful retest of the breakout level
- Higher-timeframe trend alignment

The more confirmations you have, the greater the probability of a successful trade.
Signs of a False Breakout
Be cautious when you notice:
- Long upper or lower wicks
- Weak candle closes
- Price quickly returns inside the range
- No BOS
- No displacement
- Low momentum
- Breakout during low-volume trading sessions
- Immediate rejection after the breakout
These warning signs often indicate that institutions are sweeping liquidity rather than starting a new trend.

Why Institutions Create False Breakouts
Large institutions require liquidity to execute significant orders.
To find that liquidity, they often push price beyond obvious support or resistance levels where retail traders place:
- Stop-loss orders
- Buy stop orders
- Sell stop orders
Once these orders are triggered, institutions gain the liquidity needed to enter their positions before driving price in the opposite direction.
This process is known as a liquidity sweep or stop hunt.
How to Avoid Trading False Breakouts
Instead of entering immediately after price breaks a level, wait for confirmation.
A simple process is:
- Identify a key support or resistance level.
- Wait for the breakout candle to close.
- Look for a Break of Structure (BOS).
- Watch for displacement.
- Wait for a retest of the breakout level.
- Enter only after a confirmation candle forms.
This approach helps filter out many low-quality setups.

Gold Example
Imagine Gold (XAU/USD) trading below the Previous Day Low (PDL).
False Breakout
- Price briefly falls below the PDL.
- Sellers enter aggressively.
- Price immediately rallies back above the PDL.
- The breakout fails.
Genuine Breakout
- Price closes decisively below the PDL.
- A bearish BOS forms.
- Price retests the PDL from below.
- Sellers regain control.
- Gold continues trending lower.
This simple comparison highlights why patience and confirmation are essential.

Common Mistakes
Many traders lose money because they:
- Enter before the breakout candle closes
- Ignore liquidity sweeps
- Trade every breakout without confirmation
- Skip higher-timeframe analysis
- Chase extended candles
- Ignore BOS and MSS
Avoiding these mistakes can significantly improve breakout accuracy.
Pro Tip
The safest breakout trades often occur after a liquidity sweep, followed by a Break of Structure (BOS), a retest of the breakout level, and strong displacement. Waiting for these confirmations may result in fewer trades, but it can substantially improve the quality of your setups.
📚 Continue Building Your Forex Trading Knowledge
Explore these in-depth TraderFactor guides to strengthen your Smart Money Concepts (SMC), price action, and risk management skills.
| Trading Guide | Read |
|---|---|
| How to Use CHoCH and BOS in Trading | Read → |
| How to Identify Liquidity in Forex Trading | Read → |
| Liquidity Sweep in Forex (Smart Money) | Read → |
| Buy Side vs Sell Side Liquidity Explained | Read → |
| What Is Smart Money Concept (SMC)? | Read → |
| How to Spot and Avoid Liquidity Grabs | Read → |
| Forex Breakout Strategy Guide | Read → |
| Understanding Forex Market Imbalance | Read → |
| What Is Negative Balance Protection? | Read → |
How to Trade Forex Breakouts: A Step-by-Step Strategy
Knowing how to identify a breakout is only half the battle. The next step is learning how to execute the trade with proper timing, confirmation, and risk management.
Professional traders rarely enter as soon as price breaks support or resistance. Instead, they follow a structured process that increases the probability of success while reducing unnecessary risk.
This breakout strategy combines price action, Smart Money Concepts (SMC), and ICT trading principles to help traders identify higher-quality setups.
Quick Answer
A high-probability breakout trade begins with identifying the trend and key liquidity levels, waiting for a liquidity sweep and Break of Structure (BOS), confirming momentum, entering on a retest, and managing risk with a logical stop-loss and realistic profit target.
Step 1: Identify the Market Trend
Always begin your analysis on the higher timeframes.
A simple top-down analysis might look like this:
- Weekly: Bullish
- Daily: Bullish
- 4-Hour: Bullish
- 1-Hour: Looking for buy setups only
Trading in the direction of the dominant trend generally produces more reliable breakout opportunities than trading against it.

Step 2: Mark Key Support and Resistance Levels
Next, identify areas where price is likely to react.
Important levels include:
- Previous Day High (PDH)
- Previous Day Low (PDL)
- Weekly High
- Weekly Low
- Major swing highs
- Major swing lows
- Equal Highs (EQH)
- Equal Lows (EQL)
- Psychological round numbers
These levels often contain significant liquidity and can become breakout zones.

Step 3: Wait for a Liquidity Sweep
Many of the best breakout trades begin with a liquidity sweep.
For example:
Price trades above Equal Highs
↓
Buy stop orders are triggered
↓
Institutions enter
↓
Price either reverses or begins a genuine breakout
This liquidity event often provides valuable information about market intent.
Do not assume every liquidity sweep leads to a reversal—many are simply the first stage of a strong continuation move.
Step 4: Wait for Break of Structure (BOS)
Once liquidity has been collected, wait for confirmation that market structure has shifted.
Bullish example:
Liquidity sweep
↓
Strong bullish candle
↓
Higher High forms
↓
Bullish BOS confirmed
Bearish example:
Liquidity sweep
↓
Strong bearish candle
↓
Lower Low forms
↓
Bearish BOS confirmed
A BOS confirms that buyers or sellers are beginning to take control.

Step 5: Look for Displacement
Displacement refers to an aggressive move away from the breakout level.
Characteristics include:
- Large candles
- Small wicks
- Consecutive candles
- Strong momentum
Weak, slow breakouts often fail.
Strong displacement suggests institutional participation.
Step 6: Wait for the Retest
Rather than chasing price, allow the market to revisit the breakout level.
A typical sequence looks like this:
Resistance
↓
Breakout
↓
Retest
↓
Bullish confirmation candle
↓
Buy entry
For bearish trades:
Support
↓
Breakdown
↓
Retest
↓
Bearish confirmation candle
↓
Sell entry
Waiting for the retest often produces a tighter stop-loss and better risk-to-reward ratio.
Step 7: Enter the Trade
After the retest is confirmed, execute the trade.
Bullish Entry
Entry after:
- BOS
- Retest
- Bullish confirmation candle
Bearish Entry
Entry after:
- BOS
- Retest
- Bearish confirmation candle
Avoid entering in the middle of an impulsive move where price is already extended.
Step 8: Place Your Stop-Loss
Your stop-loss should be placed where the trade idea becomes invalid.
For a buy trade:
- Below the retest low
- Below the Order Block
- Below recent liquidity
For a sell trade:
- Above the retest high
- Above the bearish Order Block
- Above recent liquidity
Avoid placing stops directly at obvious support or resistance levels where liquidity is likely to be targeted.

Step 9: Set Profit Targets
Profit targets should be based on logical market structure rather than arbitrary numbers.
Good targets include:
- Previous swing highs
- Previous swing lows
- Daily liquidity
- Weekly liquidity
- Opposing Order Blocks
- Higher-timeframe resistance
- Higher-timeframe support
Many professional traders aim for a minimum 1:2 risk-to-reward ratio, while stronger setups may allow 1:3 or 1:4.
Complete Bullish Breakout Example
Imagine Gold (XAU/USD) trading below the Previous Day High.
The sequence might look like this:
- Gold consolidates below resistance.
- Liquidity builds above Equal Highs.
- Buyers push price above resistance.
- A bullish BOS forms.
- Strong displacement follows.
- Price retests the breakout level.
- A bullish engulfing candle forms.
- Buy entry is triggered.
- Price rallies toward the next liquidity target.
This sequence demonstrates how multiple confirmations can improve the quality of a breakout trade.

Complete Bearish Breakout Example
A bearish setup follows the same logic:
- Price consolidates above support.
- Liquidity builds below Equal Lows.
- Support breaks.
- Bearish BOS forms.
- Strong displacement follows.
- Price retests the broken support.
- Bearish confirmation candle appears.
- Sell entry is triggered.
- Price continues toward lower liquidity.
Breakout Trading Checklist
Before entering any breakout trade, confirm:
- Higher-timeframe trend is clear
- Key support or resistance identified
- Liquidity sweep has occurred
- Break of Structure (BOS) confirmed
- Strong displacement present
- Fair Value Gap (optional)
- Order Block supporting the move
- Successful retest completed
- Confirmation candle formed
- Minimum 1:2 risk-to-reward ratio available
If several of these conditions are missing, it may be better to wait for a higher-quality setup.
Pro Tip
The highest-probability breakout trades are rarely the fastest. Waiting for liquidity, BOS, displacement, and a retest often leads to fewer trades but significantly improves consistency over the long term.
Risk Management for Forex Breakout Trading
Even the best breakout strategy will produce losing trades. The difference between consistently profitable traders and those who struggle is often risk management, not entry precision.
Professional traders understand that no setup is guaranteed. Instead of trying to win every trade, they focus on protecting their capital and ensuring that winning trades outweigh losing ones over time.
Quick Answer
Successful breakout trading depends as much on risk management as it does on market analysis. Using proper position sizing, logical stop-loss placement, realistic profit targets, and a favorable risk-to-reward ratio helps traders remain profitable over the long term.
Why Risk Management Matters
Breakout trading can produce strong trends, but it can also generate false breakouts and unexpected reversals.
Without proper risk management, a few losing trades can quickly erase weeks of profits.
Good risk management allows you to:
- Protect your trading capital
- Reduce emotional decision-making
- Survive losing streaks
- Stay consistent over the long term
Remember, successful trading is about consistency, not perfection.

Risk Only a Small Percentage Per Trade
One of the most common rules among professional traders is to risk only a small percentage of their trading account on each trade.
A general guideline is:
- Conservative traders: 0.5%–1%
- Moderate traders: 1%–2%
- Aggressive traders: 2% (maximum for most traders)
For example, if your account balance is $10,000 and you risk 1%, your maximum loss on a single trade would be $100.
This approach helps preserve capital during periods of poor market performance.
Place Your Stop-Loss Where the Trade Becomes Invalid
Your stop-loss should be based on market structure rather than an arbitrary number of pips.
For Bullish Breakouts
Place the stop-loss:
- Below the breakout retest
- Below the bullish Order Block
- Below the liquidity sweep
- Below the recent swing low

For Bearish Breakouts
Place the stop-loss:
- Above the breakout retest
- Above the bearish Order Block
- Above the liquidity sweep
- Above the recent swing high
Avoid placing stop-losses directly at obvious support or resistance levels, as these areas are frequently targeted during liquidity sweeps.
Aim for a Positive Risk-to-Reward Ratio
Before entering a trade, compare the potential reward with the amount you are risking.

A common benchmark is:
- Minimum 1:2 Risk-to-Reward
- Preferred 1:3 or higher for strong setups
For example:
- Risk: 50 pips
- Target: 150 pips
This creates a 1:3 Risk-to-Reward Ratio, meaning one winning trade can offset several losing trades.
Risk-to-Reward Examples
| Risk | Reward | Risk-to-Reward Ratio |
|---|---|---|
| 20 pips | 40 pips | 1:2 |
| 30 pips | 90 pips | 1:3 |
| 50 pips | 200 pips | 1:4 |
Avoid Overleveraging
Leverage increases both potential profits and potential losses.
Many new traders focus on maximizing gains but overlook the increased risk.

Instead:
- Use leverage conservatively.
- Size your position according to your stop-loss.
- Never increase your lot size simply to recover previous losses.
Capital preservation should always take priority over short-term gains.
Don’t Chase Breakouts
A common mistake is entering after price has already moved significantly.
Instead of chasing:
- Wait for the breakout.
- Allow price to retest the level.
- Enter after a confirmation candle.
This approach often improves your entry price while reducing your stop-loss distance.
Know When to Skip a Trade
One of the most valuable trading skills is knowing when not to trade.
Consider avoiding breakout trades when:
- The breakout candle has an unusually long wick.
- There is no Break of Structure (BOS).
- The move occurs during a low-liquidity session.
- Major economic news is imminent unless you specifically trade news events.
- Price is approaching a significant higher-timeframe support or resistance level.
Patience often leads to better opportunities.

Manage Winning Trades
Risk management doesn’t end after entering a position.
As the trade develops, consider:
- Moving the stop-loss to break-even after a strong move.
- Taking partial profits at key liquidity levels.
- Trailing the stop-loss behind new market structure.
- Allowing part of the position to run if momentum remains strong.
This approach helps lock in profits while still allowing participation in larger trends.

Avoid Emotional Trading
Many trading mistakes stem from emotions rather than poor analysis.
Common emotional mistakes include:
- Revenge trading after a loss
- Increasing position size to recover losses
- Closing winning trades too early
- Moving stop-losses further away
- Entering trades due to fear of missing out (FOMO)
A written trading plan can help reduce emotional decision-making and improve consistency.

Risk Management Checklist
Before entering any breakout trade, ask yourself:
- Is the setup aligned with the higher-timeframe trend?
- Have I confirmed the breakout with BOS or MSS?
- Is my stop-loss placed beyond market structure?
- Is my position size appropriate?
- Does the trade offer at least a 1:2 risk-to-reward ratio?
- Am I risking no more than my predefined percentage?
- Is there a clear profit target?
- Am I following my trading plan?
If the answer to any of these questions is no, consider waiting for a better opportunity.
Pro Tip
Professional traders focus on protecting capital first and generating profits second. A disciplined trader with sound risk management can remain profitable even with a win rate below 50%, provided their average winning trade is significantly larger than their average losing trade.
Best Indicators to Use for Forex Breakout Trading
When it comes to breakout trading in the forex market, using the right indicators can help you identify potential breakouts and confirm their strength. Here are some of the best indicators to consider:
Bollinger Bands
Bollinger Bands are a popular volatility indicator that consist of three lines plotted on the price chart. The middle band is a simple moving average (typically 20 periods), while the upper and lower bands represent the standard deviations from the moving average. Breakouts often occur when the price breaks above or below the outer bands, indicating increased volatility and potential trend continuation.
Moving Average
Moving averages are widely used indicators that help identify trend direction and potential breakout points. Traders often use the crossover of two moving averages or the price crossing above or below a moving average as a sign of a breakout. For example, when a shorter-term moving average crosses above a longer-term moving average, it could indicate an upward breakout signal.

Relative Strength Index (RSI)
The RSI is a momentum oscillator that measures the speed and change of price movements. It ranges from 0 to 100 and is typically used to identify overbought and oversold conditions. In breakout trading, traders look for the RSI to move above 70 for a bullish breakout or below 30 for a bearish breakout. This can help confirm the strength of the breakout and potential trend continuation.
Ichimoku Cloud
The Ichimoku Cloud is a comprehensive indicator that provides multiple pieces of information in one visual display. It consists of several lines and a shaded area called the cloud. When the price breaks above or below the cloud, it can signal a potential breakout. Additionally, the Tenkan-sen (conversion line) crossing above the Kijun-sen (base line) can provide a bullish breakout signal, while the opposite can indicate a bearish breakout.
Average True Range (ATR)
The ATR is a volatility indicator that measures the average range between high and low prices over a specific period. Traders can use the ATR to determine the potential price range and volatility levels. A breakout that is accompanied by a significant increase in ATR suggests a potentially strong breakout with higher volatility.

Remember that indicators should not be used in isolation, but in conjunction with other analysis techniques to increase the likelihood of successful breakout trades. Additionally, it’s important to test and adapt your indicator settings and strategies based on the specific currency pairs and timeframes you trade.
Risk Management Strategies for Breakout Trading

When trading breakouts in the forex market, implementing effective risk management strategies is crucial to protect your capital and maximize your profits. Here are some key strategies to consider:
Use a stop-loss order
Placing a stop-loss order is an essential risk management tool for breakout traders. A stop-loss order instructs your broker to automatically close your position if the price moves against you beyond a certain, price level. By setting a stop-loss order, you limit your potential losses and protect your trading account from significant drawdowns.
Set a profit target
In addition to setting a stop-loss order, it’s important to have a predefined profit target for your breakout trades. A profit target determines your entry point and exit point, and when you will exit the trade and lock in your gains. It helps you maintain discipline and avoid holding onto a winning trade for too long, which can result in giving back profits if the market reverses.

Use proper position sizing
Proper position sizing is vital for managing risk in breakout trading. Determine the appropriate position size based on your account size and risk tolerance. Many traders recommend risking only a small percentage of your trading capital (e.g., 1-2%) on each trade. This way, even if multiple trades result in losses, you can withstand the drawdown and continue trading.
Consider the market conditions
Market conditions can greatly impact the success of breakout trades. When assessing market conditions, consider factors such as volatility, liquidity, and overall trend. Breakouts tend to work best in trending markets with higher volatility and sufficient trading volume. Avoid trading breakouts in sideways or range-bound markets where false breakouts are more common.
Avoid overtrading
Overtrading is a common mistake that can lead to increased risk and poor decision-making. Stick to your trading plan and avoid the temptation to enter trades that do not meet your breakout criteria. Wait for high-quality setups with clear breakout signals and favorable risk-to-reward ratios. By being selective and disciplined, you can avoid unnecessary losses and focus on the most promising breakout opportunities.

Implementing these risk management strategies can help you protect your trading capital, minimize losses, and increase your overall profitability in breakout trading. Remember to regularly review and adjust your risk management approach as market conditions change.
Common Mistakes to Avoid When Trading Breakouts

When trading breakouts in the forex market, it’s crucial to be aware of common pitfalls that can hinder your success. By avoiding these mistakes, you can improve your forex trading strategy and increase your profitability. Here are some common mistakes to be mindful of:
Chasing the breakout
One common mistake is entering a trade too late, after the breakout has already occurred and the price has moved down the trend line even more significantly. This can result in entering at unfavorable prices and missing out on potential profits. It’s important to wait for a proper setup and confirmation down trend, before entering a trade.
Failing to use stop-loss orders
A stop-loss order is an essential risk management tool that helps limit potential losses. Failing to set and adhere to stop-loss orders can expose you to significant risks. By setting a stop-loss order at a reasonable price level, you can protect yourself from large losses if the breakout fails or reverses.
Overtrading
Overtrading is a common mistake made by traders who try to capture every breakout opportunity. It’s important to remember that not all breakouts are successful, and trading too frequently can lead to unnecessary losses. Be selective and focus on high-quality setups rather than trading impulsively.
Not considering market conditions
Market conditions can greatly influence the success of breakout trades. Failing to consider factors such as volatility, liquidity, and overall market sentiment can result in trading breakouts in unfavorable conditions. Take into account the broader market context and adjust your trading strategy accordingly.
Ignoring risk management
Proper risk management is crucial in trading breakouts. Failing to assess and manage risk appropriately can lead to significant losses. Determine your risk tolerance, set realistic profit targets, and ensure your risk-to-reward ratio is favorable before entering a trade.

Holding onto losing trades
Holding onto losing trades in the hope that they will eventually turn profitable is a common mistake made by traders worldwide. Breakout trades can sometimes fail, and it’s important to cut your losses and move on. Accepting small losses day trading, is part of the trading process and helps preserve your capital for future opportunities.
By being aware of these common mistakes many traders make and actively avoiding them even a novice of, you can enhance your breakout trading strategy. Remember to approach breakout trading strategy with discipline, patience, and a focus on risk management to increase your chances of success.
Frequently asked questions about the Forex breakout strategy

What is a forex breakout strategy?
A forex breakout strategy is a trading approach that involves entering a trade when price breaks above a significant resistance level or below a key support level. Traders aim to profit from the strong momentum that often follows these breakouts. Professional traders typically wait for confirmation, such as a Break of Structure (BOS) or a successful retest, before entering a position.
How do you confirm a breakout in forex?
A breakout is more reliable when it is supported by multiple confirmations, including:
- A strong candle close beyond support or resistance
- Break of Structure (BOS)
- Market Structure Shift (MSS)
- High momentum or displacement
- Liquidity sweep before the breakout
- Successful retest of the breakout level
- Alignment with the higher-timeframe trend
The more confirmations present, the higher the probability of a successful breakout.

What causes forex breakouts?
Forex breakouts occur when buying or selling pressure overwhelms existing orders around key price levels. Common catalysts include:
- Institutional order flow
- Liquidity sweeps
- Economic news releases
- London and New York session opens
- Central bank announcements
- Volatility expansion after periods of consolidation
What is a false breakout?
A false breakout, also known as a fakeout, occurs when price briefly breaks above resistance or below support but quickly reverses back into the trading range. These moves often trigger stop-loss orders before institutions move the market in the opposite direction.
How can I avoid false breakouts?
You can reduce the risk of trading false breakouts by:
- Waiting for the breakout candle to close
- Looking for a Break of Structure (BOS)
- Waiting for a retest
- Confirming momentum
- Trading with the higher-timeframe trend
- Avoiding trades during low-liquidity periods
Patience is often more valuable than entering early.

Which timeframe is best for breakout trading?
The best timeframe depends on your trading style.
| Trading Style | Recommended Timeframe |
|---|---|
| Scalping | M1 – M5 |
| Day Trading | M15 – H1 |
| Swing Trading | H4 – Daily |
| Position Trading | Daily – Weekly |
Many traders use top-down analysis by identifying the trend on higher timeframes before looking for breakout entries on lower timeframes.
Which forex pairs are best for breakout trading?
Several currency pairs are known for producing reliable breakout opportunities due to their liquidity and volatility, including:
- EUR/USD
- GBP/USD
- USD/JPY
- GBP/JPY
- AUD/USD
- USD/CAD
Gold (XAU/USD), NASDAQ (US100), and Bitcoin (BTC/USD) are also popular markets for breakout trading.
Which trading session produces the best breakouts?
The strongest breakout opportunities often occur during:
- London Open
- New York Open
- London–New York overlap
These sessions have the highest trading volume and institutional participation, increasing the likelihood of sustained price movements.
Is breakout trading profitable?
Breakout trading can be profitable when combined with proper confirmation, disciplined risk management, and a well-defined trading plan. Success depends on identifying high-quality setups rather than trading every breakout that appears.
Should I wait for a breakout retest?
Yes. Waiting for a breakout retest is one of the most effective ways to improve trade quality. A successful retest confirms that the broken support or resistance level has become a new area of support or resistance, often providing a better entry price and tighter stop-loss.
What indicators are best for breakout trading?
Popular breakout indicators include:
- Average True Range (ATR)
- Bollinger Bands
- Moving Averages
- Relative Strength Index (RSI)
- MACD
- Donchian Channels
- Keltner Channels
- Volume (where available)
Indicators work best when combined with price action and market structure analysis.
What is a Break of Structure (BOS)?
A Break of Structure (BOS) occurs when price breaks a previous swing high in an uptrend or a previous swing low in a downtrend. BOS confirms that buyers or sellers have gained control and often strengthens the validity of a breakout.
What is the difference between BOS and CHOCH?
A Break of Structure (BOS) confirms the continuation of an existing trend, while a Change of Character (CHOCH) signals a potential trend reversal. Traders often use both concepts to assess whether a breakout is likely to continue or fail.
How do ICT and Smart Money traders approach breakouts?
ICT and Smart Money traders focus on institutional order flow rather than trading every breakout. They look for:
- Liquidity sweeps
- Break of Structure (BOS)
- Market Structure Shift (MSS)
- Fair Value Gaps (FVGs)
- Order Blocks
- Premium and Discount zones
- Confirmation after a retest
This approach aims to trade alongside institutional activity instead of following retail traders.

Where should I place my stop-loss when trading breakouts?
A stop-loss should be placed where the trade idea becomes invalid.
For bullish breakouts, common locations include:
- Below the retest low
- Below a bullish Order Block
- Below the recent swing low
For bearish breakouts:
- Above the retest high
- Above a bearish Order Block
- Above the recent swing high
Avoid placing stop-losses directly at obvious support or resistance levels where liquidity is concentrated.
What is a good risk-to-reward ratio for breakout trading?
Many professional traders aim for a minimum 1:2 risk-to-reward ratio, meaning the potential reward is at least twice the amount being risked. Higher-quality breakout setups may offer opportunities with 1:3 or even 1:4 risk-to-reward ratios.
Can beginners trade forex breakouts?
Yes. Breakout trading is suitable for beginners because support and resistance levels are relatively easy to identify. However, new traders should focus on learning confirmation techniques, risk management, and market structure rather than trading every breakout they see.
Is breakout trading suitable for Gold (XAU/USD)?
Yes. Gold is one of the most actively traded markets for breakout strategies due to its volatility and strong reactions during the London and New York sessions. Many traders combine breakout trading with liquidity analysis, Previous Day High (PDH), Previous Day Low (PDL), and Smart Money Concepts to improve their entries.
What is the biggest mistake breakout traders make?
The most common mistake is entering a trade immediately after price breaks support or resistance without waiting for confirmation. Other frequent mistakes include ignoring the higher-timeframe trend, chasing overextended moves, using poor risk management, and trading during low-liquidity conditions.
Do breakout strategies work in all market conditions?
No. Breakout strategies perform best in markets that are transitioning from consolidation to expansion. During choppy or low-volatility conditions, false breakouts become more common. Traders should assess the overall market environment before applying a breakout strategy.

What is a Forex breakout trading strategy?
A Forex breakout strategy is a trading technique that involves identifying key levels of support and resistance and placing trades when the price breaks out of these levels with strong momentum. Traders aim to take advantage of significant price movements that occur after a breakout.
How does the Forex breakout strategy work in financial markets
The Forex breakout strategy works by identifying consolidation periods in the market where the price is range-bound between support and resistance levels. Traders wait for the price to break above or below these levels, indicating a potential trend reversal or continuation, and enter trades accordingly.
What are the benefits of using Forex breakout trading strategies?
Using a Forex breakout strategy can provide several benefits many traders, including the ability to catch large price movements, increased trading opportunities, clear enough entry points and exit signals, and the potential for high-profit trades.
What indicators can be used to identify breakouts?
Traders often use indicators such as moving averages, Bollinger Bands, and the Average True Range (ATR) to identify potential breakouts. These indicators help to confirm the strength and validity of a breakout.
How do I determine the best time frame for breakout trading?
The choice of time frame to trade on depends on your trading style and preferences. Shorter time frames like 5-minute or 15-minute charts can provide more frequent trading opportunities, while longer time frames like daily or weekly charts offer more reliable and significant breakouts.
How do I manage risk when trading breakouts?
Risk management is crucial when planning your breakout trading strategies. Traders often use stop-loss orders to limit potential losses if the breakout fails. Additionally, they may employ proper position sizing techniques and consider implementing trailing stops to protect profits.
Are there any drawbacks to breakout trading strategy?
One drawback of breakout trading is the possibility of false breakouts, where the price briefly breaks out of a level but quickly reverses. This can result in losses if traders enter trades based on these false breakout signals. It is essential to use confirmatory indicators and analyze the market context before entering trades on trade breakouts.
Are there any strategies to filter out false breakouts?
Yes, traders can use additional filters to reduce the likelihood of trading false breakouts. These may include analyzing the volume during the breakout, looking for multiple time frame confirmations, or waiting for a pullback and retest of the breakout level before entering a trade.
What are Price Patterns
Price patterns are a popular tool used by traders to analyze and predict market movements based on the price movements alone, without relying on indicators or other technical tools. These patterns can provide valuable insights into market trends, reversals, and continuations. Here are some commonly used, price action trading patterns:
Reversal Bar: This pattern occurs when the price forms a bar that indicates a potential reversal in the current trend. It often has a long wick or tail, signaling a rejection of previous price levels.
Key Reversal Bar: Similar to the reversal bar, the key reversal bar signifies a potential trend reversal. It typically has a wide range and engulfs the preceding bars.
Pinocchio Bar: Also known as a pin bar, this pattern has a long tail or wick, indicating a rejection of a certain price level. It can be a bullish or bearish signal, depending on its location within the trend.
Exhaustion Bar: The exhaustion bar suggests a weakening of the prevailing trend. It often has a high volume and a wide range, indicating that the buyers or sellers are losing momentum.
Three-Bar Pullback: This pattern occurs when the price temporarily retraces against the prevailing trend for three consecutive bars. It is often followed by a continuation of the original trend.
False Break: A false break happens when the price briefly breaks a significant support or resistance level but quickly reverses and moves back in the opposite direction. It can trap traders who enter trades based on the breakout.

These price action patterns are just a few examples of the many price movement patterns that traders use to make trading decisions. It’s important to understand that price action patterns should be used in conjunction with other technical analysis tools and should be validated by market context and other indicators.
Points To Keep In Mind About Breakout Trading Strategy
The Forex Breakout Strategy is a powerful tool that can help traders capitalize on the volatility and momentum in the forex market. By understanding the concepts of support and then resistance price levels, identifying breakout setups and price move, using chart patterns and using technical indicators, traders can increase their chances of profitable trading.
The ability to identify key levels of support and resistance on a forex chart is essential for successful breakout trading. These levels serve as potential entry and exit points, giving traders a clear framework for executing forex trades on. Additionally, using technical indicators such as the RSI and MACD can provide confirmation of a potential breakout, increasing the reliability of forex trade signals.
Volume, technical analysis, and monitoring news events are crucial components of breakout trading. High trading volume during a breakout suggests strong market participation, while keeping an eye on news events helps traders anticipate potential trends and catalysts for breakouts. By combining these factors, traders can make more informed trading decisions, and improve their trading outcomes.
Price action analysis further solidifies the validity of breakouts by observing chart pattern on the candlestick charts and the movement of price action traders on the chart. Strong enough price action trading on candlestick charts and patterns can confirm the breakout and provide additional conviction for traders to enter or exit positions.
However, it’s important to remember that risk management is a simple strategy and paramount in breakout trading. Setting appropriate position sizes, using stop-loss orders, and maintaining a favorable risk-to-reward ratio are essential to protect capital and preserve long-term profitability in short trades.
Conclusion

By following the strategies outlined in this guide and mastering the art of breakout trading in forex markets, traders can potentially unlock new opportunities for profit in the forex market. Remember, practice, discipline, and continuous learning are key to become a successful breakout trader in forex markets.
Read these next;
Forex Consolidation Breakout Strategies for Traders
Managing Risks in Forex Trading Without Brokers
Understanding Forex Market Imbalance and How to Use It
📚 Continue Building Your Forex Trading Knowledge
Explore these in-depth TraderFactor guides to strengthen your Smart Money Concepts (SMC), price action, and risk management skills.
| Trading Guide | Read |
|---|---|
| How to Use CHoCH and BOS in Trading | Read → |
| How to Identify Liquidity in Forex Trading | Read → |
| Liquidity Sweep in Forex (Smart Money) | Read → |
| Buy Side vs Sell Side Liquidity Explained | Read → |
| What Is Smart Money Concept (SMC)? | Read → |
| How to Spot and Avoid Liquidity Grabs | Read → |
| Forex Breakout Strategy Guide | Read → |
| Understanding Forex Market Imbalance | Read → |
| What Is Negative Balance Protection? | Read → |
About the Author
Zahari Rangelov
Head of Business Development, TraderFactor
Zahari specializes in broker analysis, regulatory research, and trading education. He has over a decade of experience helping traders navigate the complex world of online brokers. His expertise spans technical and fundamental analysis, medium-term trading strategies, risk management, and trading psychology. A respected mentor and speaker, Zahari regularly leads webinars and seminars covering market sentiment, speculative instruments, and automated trading systems. His research-backed, practical approach has established him as a trusted authority within the global trading community.

Reviewed By:
Reviewed by Alex Kanyi, Head of Compliance at TraderFactor
“This report is for general information only. Trading involves significant risk. Seek independent advice before acting on any content.”
