


Divergence in Forex Trading: Regular, Hidden, RSI & MACD Guide
Divergence in forex trading occurs when price and a momentum indicator begin telling different stories. Price may continue making new highs or lows while indicators such as the Relative Strength Index (RSI), MACD or Stochastic Oscillator show weakening or strengthening momentum.
For forex traders, this difference can provide an early warning that a trend may be losing strength, preparing for a reversal, or getting ready to continue after a temporary pullback.
Key Takeaways
- Regular divergence is mainly associated with potential trend reversals.
- Hidden divergence is normally associated with trend continuation.
- RSI, MACD, Stochastic and CCI can all be used to identify divergence.
- Divergence is stronger when supported by market structure, liquidity, support/resistance or candlestick confirmation.
- Divergence should not be treated as an automatic buy or sell signal.
Table of Contents
What Is Divergence in Forex Trading?
Divergence happens when the direction of price differs from the direction of a momentum indicator. The trader compares significant swing highs and swing lows on the price chart with corresponding highs and lows on an oscillator.
For example, EURUSD may print a lower low, suggesting that sellers are still in control. However, if RSI creates a higher low at the same time, bearish momentum may be weakening. This is known as bullish divergence.
The opposite happens when price creates a higher high but the indicator creates a lower high. That difference may indicate that bullish momentum is weakening.
Price tells you where the market is going.
Momentum tells you how strongly it is getting there.
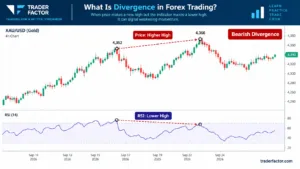
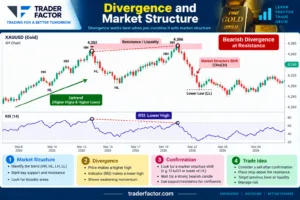
At the same time, the RSI fails to make a new high and instead forms a lower high.
That mismatch is the divergence:
- Price: Higher high
- RSI: Lower high
- Signal: Bearish divergence
- Meaning: Gold is still rising, but buying momentum is weakening
- What traders watch next: A rejection, structure break, or other bearish confirmation before considering a sell setup
The move back toward 4,340 after the second high shows how price can start weakening once momentum fades.
How Does Forex Divergence Work?
Markets rarely move in a straight line. An uptrend normally contains a sequence of higher highs and higher lows, while a downtrend often creates lower highs and lower lows.
You can learn more about this concept in our guide to swing highs and swing lows in forex .
Momentum indicators measure the strength or speed behind those price movements. When price pushes to a fresh extreme but momentum cannot confirm that move, traders describe the situation as divergence.
That does not guarantee a reversal. Instead, divergence tells traders to pay closer attention to price action and look for additional evidence.

Types of Divergence in Forex
There are two major categories every trader should understand: regular divergence and hidden divergence. Each can be either bullish or bearish.
Regular Divergence
Regular divergence is generally used to identify situations where the current trend may be losing momentum. It is therefore most commonly associated with potential market reversals.
Regular Bullish Divergence
Regular bullish divergence occurs when:
- Price creates a lower low.
- The oscillator creates a higher low.
Price may still look bearish, but momentum is no longer confirming the new low. Sellers may be losing strength.
Price = Lower Low ↓
Indicator = Higher Low ↑
Regular Bearish Divergence
Regular bearish divergence occurs when:
- Price creates a higher high.
- The oscillator creates a lower high.
Although buyers have managed to push price to another high, momentum is weaker than during the previous price high. This may warn that buyers are becoming exhausted.
Price = Higher High ↑
Indicator = Lower High ↓

Hidden Divergence
Hidden divergence works differently. Instead of primarily searching for reversals, traders often use hidden divergence to identify possible continuation of an existing trend.
Hidden Bullish Divergence
Hidden bullish divergence occurs during an uptrend when:
- Price creates a higher low.
- The indicator creates a lower low.
Price has successfully protected its previous structural low even though momentum temporarily weakened. This can suggest that the broader bullish trend remains intact.
Hidden Bearish Divergence
Hidden bearish divergence occurs during a downtrend when:
- Price creates a lower high.
- The indicator creates a higher high.
The oscillator may show a strong temporary recovery, but price itself cannot break the previous major high. That can indicate that sellers still control the broader market structure.
Regular Divergence vs Hidden Divergence
Regular divergence: Look for a possible reversal.
Hidden divergence: Look for possible trend continuation.
This distinction is important because traders frequently make the mistake of treating every divergence signal as a reversal.

RSI Divergence in Forex Trading
The Relative Strength Index (RSI) is one of the most popular indicators for identifying forex divergence. RSI measures momentum on a scale from 0 to 100.
Bullish RSI Divergence
Bullish RSI divergence appears when price creates a lower low while RSI creates a higher low. This indicates that downside momentum may be weakening.
Bearish RSI Divergence
Bearish RSI divergence appears when price creates a higher high while RSI creates a lower high. This can indicate fading upside momentum.
MACD Divergence in Forex
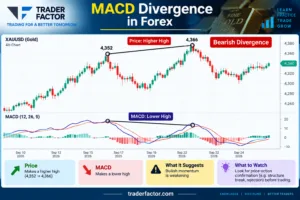
The Moving Average Convergence Divergence (MACD) indicator is another widely used divergence tool. Traders can compare price swings with either the MACD lines or histogram.
A bullish MACD divergence occurs when price creates a lower low while MACD forms a higher low. A bearish MACD divergence appears when price creates a higher high while MACD forms a lower high.
MACD divergence can become more meaningful when accompanied by a change in market structure, a crossover or a strong reaction from a significant support or resistance area.
Stochastic Divergence
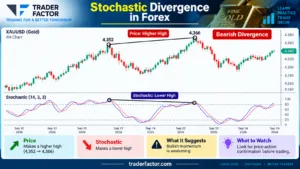
The Stochastic Oscillator can also highlight differences between price and momentum. Because Stochastic is sensitive to short-term momentum changes, traders often use it around significant swing highs and lows.
Bullish Stochastic divergence develops when price forms a lower low while Stochastic forms a higher low. Bearish Stochastic divergence occurs when price forms a higher high while Stochastic produces a lower high.
Read our guide to technical indicators for forex trading for more information about RSI, MACD and Stochastic.
CCI Divergence
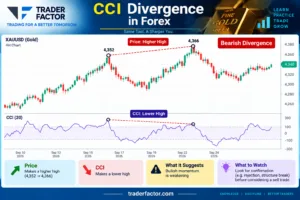
The Commodity Channel Index (CCI) can also be used to compare changes in momentum against price swings. Like other oscillators, traders normally compare equivalent swing points rather than random highs and lows.
CCI divergence is less commonly discussed than RSI or MACD divergence, but the underlying principle remains the same: price makes a new extreme while momentum fails to confirm it.
Divergence and Market Structure
Divergence becomes much more useful when it is analyzed alongside market structure. Instead of asking only:
“Do I see divergence?”
Ask: “Where is this divergence occurring?”
A bullish divergence forming in the middle of a random trading range may carry less context than bullish divergence forming after price attacks an important swing low, support level or pool of sell-side liquidity.
Likewise, bearish divergence appearing after a sweep of a significant previous high may deserve more attention than bearish divergence appearing without any important market structure nearby.
Divergence and Liquidity Sweeps
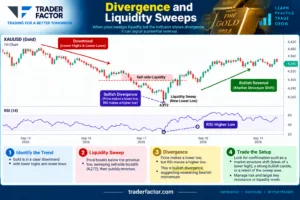
Traders using Smart Money Concepts (SMC) or ICT-style analysis may combine divergence with liquidity.
Imagine that EURUSD trades below a previous swing low and sweeps sell-side liquidity. Price creates a new lower low, but RSI creates a higher low.
This produces regular bullish divergence.
The trader may then wait for evidence that price is actually changing direction, such as:
- A bullish displacement candle
- A market structure shift
- A CHoCH
- A break of a short-term swing high
- A Fair Value Gap forming after displacement
- A strong rejection from support
How to Confirm a Forex Divergence Signal
One of the biggest mistakes traders make is entering immediately after spotting divergence. Divergence is better treated as an alert that tells you to start looking for confirmation.
1. Support and Resistance
Check whether the divergence is forming at a major technical level. A bullish divergence at significant support can carry more context than the same pattern appearing in the middle of a range.
2. Market Structure Shift
For bullish divergence, watch whether price stops making lower lows and breaks a short-term lower high. For bearish divergence, watch whether price stops making higher highs and breaks a short-term higher low.
3. Candlestick Confirmation
Strong rejection candles, engulfing patterns or displacement can provide additional evidence that market participation is changing.
4. Liquidity Sweep
Look for divergence after price trades through a significant previous high or low and then rejects that area.
5. Higher-Timeframe Bias
A divergence signal on a lower timeframe should be analyzed within the broader market structure. A small bearish divergence against a powerful daily uptrend may produce only a brief pullback.

How to Trade Divergence in Forex
Step 1: Identify the Market Trend
Determine whether price is trending upward, downward or ranging. This helps you decide whether you are looking for a reversal or continuation setup.
Step 2: Mark Significant Swing Highs and Lows
Do not compare random candles. Use meaningful market swings that are clearly visible on the chart.
Step 3: Compare Price With Your Indicator
Check whether RSI, MACD, Stochastic or another momentum oscillator confirms the latest price swing.
Step 4: Classify the Divergence
Determine whether it is regular bullish, regular bearish, hidden bullish or hidden bearish divergence.
Step 5: Wait for Confirmation
Look for structure, support/resistance, liquidity, candlestick reaction or momentum confirmation.
Step 6: Define Invalidation
Before entering, determine exactly what price action would prove your trade idea wrong.
Step 7: Determine Your Target
Potential targets can include previous highs or lows, opposing liquidity, support/resistance or another predefined technical objective.
Example of Bullish Divergence
Suppose GBPUSD has been trending downward. Price falls from one swing low and later creates another lower low.
However, RSI behaves differently:
- First RSI low: 26
- Second RSI low: 34
Price has created a lower low, while RSI has created a higher low. This is regular bullish divergence.
Instead of immediately buying, a trader could wait for price to reclaim a nearby short-term swing high. If that happens with strong bullish displacement, the trader now has both divergence and price-action confirmation.

Example of Bearish Divergence
Suppose EURUSD rallies and creates a new swing high. A few hours later, price extends slightly higher and creates another higher high.
MACD, however, creates a lower high.
That is regular bearish divergence. It tells the trader that bullish momentum has weakened even though price has reached a new high.
The trader could then watch for a bearish market structure shift before considering a short setup.
When Forex Divergence Fails
Divergence can remain present for a long time while price continues trending. This is particularly common during powerful directional markets.
Strong Trends
Momentum can weaken without immediately reversing the trend. Price may consolidate briefly and then continue in the same direction.
Entering Too Early
A trader may identify divergence correctly but enter before price confirms a reversal. Timing remains important.
Comparing the Wrong Swing Points
The highs or lows being compared on the price chart should correspond with the same areas on the oscillator. Otherwise the divergence may be misleading.
Lower-Timeframe Noise
Very small timeframes can produce frequent momentum fluctuations and more potential false signals. Always consider the larger market context.
Major Economic News
Central-bank decisions, inflation data, employment reports and unexpected geopolitical developments can rapidly change price momentum. Technical signals should therefore be considered alongside current market conditions.

Common Divergence Trading Mistakes
- Trading divergence without confirmation.
- Ignoring the higher-timeframe trend.
- Forcing divergence between unrelated swing points.
- Assuming every divergence means reversal.
- Using too many oscillators simultaneously.
- Entering before the candle or structure confirms.
- Ignoring stop-loss placement.
- Risking too much because the setup “looks perfect.”
Which Indicator Is Best for Forex Divergence?
| Indicator | Useful For | Key Characteristic |
|---|---|---|
| RSI | Momentum divergence | Simple and visually clear |
| MACD | Momentum and trend context | Combines momentum with moving-average relationships |
| Stochastic | Shorter-term momentum | Sensitive to momentum extremes |
| CCI | Momentum deviations | Measures price deviation from its statistical average |
There is no single divergence indicator that works best in every market condition. Traders should test each indicator and understand how it behaves on the instruments and timeframes they trade.

What Timeframe Is Best for Divergence?
Divergence can appear on virtually every timeframe. However, lower timeframes generally contain more market noise.
Swing traders may prefer the 4-hour or daily chart, while intraday traders may monitor the 15-minute, 30-minute or 1-hour charts.
A useful approach is multi-timeframe analysis:
- Use a higher timeframe to determine market direction.
- Use a lower timeframe to identify divergence and refine entry timing.
- Make sure the lower-timeframe setup does not completely contradict the larger market structure without strong evidence.
Divergence and Risk Management
Even an excellent divergence setup can fail. Risk management therefore remains essential.
Before entering a trade, determine:
- Where the setup becomes invalid.
- How much capital you are willing to risk.
- Where the stop loss should be placed.
- Whether the potential reward justifies the risk.
- Where partial or full profits could be taken.

TraderFactor Rule
A beautiful divergence pattern is still only a trading idea. Protecting capital comes first.
Forex Divergence Checklist
Before trading a divergence setup, ask:
✅ Is price at a meaningful swing high or low?
✅ Am I comparing the correct price swings?
✅ Is the divergence regular or hidden?
✅ What is the higher-timeframe trend?
✅ Has liquidity been swept?
✅ Is the setup near support or resistance?
✅ Has market structure shifted?
✅ Do I have entry confirmation?
✅ Where is my invalidation?
✅ Is the risk acceptable?
Forex Divergence FAQs
What is divergence in forex trading?
Divergence in forex trading occurs when price movement differs from the movement of a momentum indicator. Traders use this difference to identify possible changes in market momentum.
What is bullish divergence?
Regular bullish divergence occurs when price creates a lower low while the momentum indicator creates a higher low. It may indicate that bearish momentum is weakening.
What is bearish divergence?
Regular bearish divergence occurs when price creates a higher high while the momentum indicator creates a lower high. It may indicate weakening bullish momentum.
What is hidden divergence?
Hidden divergence is a type of divergence generally associated with trend continuation. Hidden bullish divergence occurs when price creates a higher low while the indicator creates a lower low. Hidden bearish divergence occurs when price creates a lower high while the indicator creates a higher high.
What is the difference between regular and hidden divergence?
Regular divergence is commonly used to identify potential reversals. Hidden divergence is generally used to identify potential continuation of an existing trend.
Is RSI divergence reliable?
RSI divergence can provide useful information about changing momentum, but it should not be treated as a guaranteed trading signal. Market structure, support and resistance, liquidity and price-action confirmation can provide additional context.
Does divergence always mean a reversal?
No. Divergence can remain present while price continues trending. Regular divergence warns of a possible momentum shift, but traders should wait for confirmation before assuming that a reversal has begun.
Can divergence be used for forex scalping?
Yes. Divergence can appear on lower timeframes used by scalpers. However, lower timeframes may generate more market noise and false signals, making confirmation and strict risk management particularly important.
Can divergence be used with Smart Money Concepts?
Yes. Traders can combine divergence with liquidity sweeps, market structure shifts, Fair Value Gaps, support and resistance and other price-action concepts. The divergence highlights momentum while SMC analysis can provide additional context for location and market structure.

Final Thoughts
Divergence in forex trading is best understood as a warning that price and momentum are no longer behaving in the same way. That information can help traders identify potential reversals, continuation setups and weakening trends.
Regular divergence can help highlight potential reversals, while hidden divergence can help traders identify possible trend continuation. RSI, MACD, Stochastic and CCI can all be used to identify these differences.
However, divergence becomes more useful when combined with market structure, support and resistance, liquidity, candlestick confirmation and disciplined risk management.
The Bottom Line
Do not trade divergence simply because two lines are moving in opposite directions. Understand where the divergence is forming, what type it is, what the higher-timeframe structure is showing, and what would confirm or invalidate the idea.
That turns divergence from a simple indicator signal into a complete trading framework.
📚 Master Forex Trading with TraderFactor
Build your trading edge with expert guides covering Smart Money Concepts (SMC), liquidity, market structure, price action and professional risk management.
📈 CHoCH & BOS Trading GuideLearn how Smart Money traders identify trend reversals using Change of Character and Break of Structure. | 💧 Identify LiquidityUnderstand where institutional traders hunt liquidity before major market moves. |
🎯 Liquidity Sweep StrategyMaster one of the most powerful Smart Money Concepts used before major reversals. | ⚖ Buy Side vs Sell Side LiquidityUnderstand where institutions target stop-losses and how liquidity drives price. |
🏦 Smart Money Concepts (SMC)Complete beginner’s guide to institutional trading and market structure. | 🚨 Avoid Liquidity GrabsLearn to recognize fake breakouts before they trap retail traders. |
📊 Forex Breakout StrategyDiscover how to trade high-probability breakout opportunities with confidence. | ⚡ Market Imbalance GuideUnderstand Fair Value Gaps and institutional imbalances like a professional trader. |
🛡 Protect Your Trading CapitalDiscover why Negative Balance Protection is essential for every forex trader and how it helps safeguard your account during periods of extreme market volatility. | |
| 🚀 Top-Rated Forex Broker Reviews Compare brokers, spreads, leverage, platforms & trading conditions. | ||
|---|---|---|
| 🔥 IronFX Trading Conditions | ⭐ PU Prime Spreads & Platforms | 📈 NAGA Social Trading |
| ⚡ TMGM Execution Speed | 💹 M4 Markets Account Types | 💼 RS Prime Broker Overview |
| 👑 OneRoyal Regulation & Safety | 🎯 Skilling Platform Review | 📊 DeltaStock Broker Features |
| 🚀 Eightcap Trading Experience | 🧪 Alchemy Markets Broker Analysis | ✅ ActivTrades Expert Review |
| 💰 VS Capital Broker Rating | ⚖️ High Leverage Compare Leverage | 📉 Low Spreads Trading Costs |
| Compare Broker Features, Costs, Regulation, Platforms & Leverage Explore our independent broker reviews before choosing your next trading account. | ||
About the Author
Zahari Rangelov
Head of Business Development, TraderFactor
Zahari specializes in broker analysis, regulatory research, and trading education. He has over a decade of experience helping traders navigate the complex world of online brokers. His expertise spans technical and fundamental analysis, medium-term trading strategies, risk management, and trading psychology. A respected mentor and speaker, Zahari regularly leads webinars and seminars covering market sentiment, speculative instruments, and automated trading systems. His research-backed, practical approach has established him as a trusted authority within the global trading community.

Reviewed By:
Reviewed by Alex Kanyi, Head of Compliance at TraderFactor
“This report is for general information only. Trading involves significant risk. Seek independent advice before acting on any content.”

No comments:
Post a Comment